Trust Issues: How Jaffle Shop Rebuilt Stakeholder Confidence with Recce
TL;DR: If stakeholders can’t trust the numbers, why would they trust the people behind them?
While investigating an issue initially raised by marketing, the Jaffle Shop data team discovered something bigger: revenue numbers were wrong, and had been for a while.
Regaining confidence required transparency, context, and hours of manual effort: SQL tracing, ad-hoc queries, spreadsheet exports, and slow back-and-forth with stakeholders.
Using Recce, the team can instead now investigate in under 10 minutes, show what changed, and align with business stakeholders in one shared view.
Recce unlocks velocity not by cutting corners, but by making clarity repeatable.
👉 This story is live on Recce Cloud. You can explore the full investigation environment here: https://cloud.datarecce.io/share/4793641b-8ce5-46e5-84e3-7a76cc8b4c1b
How It Started: Marketing’s Intuition
At Jaffle Shop, the marketing team relied on Customer Lifetime Value (CLV) to guide their marketing campaigns, but something felt off. “High-value” customers weren’t converting as expected, and performance didn’t match projections.
They turned to the data team to investigate, and what came next surprised everyone.
As the data team traced the CLV logic foundations, they found more than just a marketing anomaly. The issue went deeper, to teams that hadn’t even noticed yet, like finance.
When they retraced the data models, they discovered:
- CLV erroneously included all orders—
placed,shipped, evenreturn-pending—instead of justcompletedones. - Revenue mistakenly excluded coupon discounts offered to customers, meaning discounted products were being treated in revenue calculations as if they sold at full price.
For marketing, this explained the mismatch: they were targeting “high-value” customers who never actually generated high-value revenue.
But for finance, the discovery was even more alarming. They hadn’t raised a flag because they didn’t even know there was a problem, but the truth was that revenue metrics had been quietly overstated for months. The Marketing team’s intuition exposed how flawed data had been quietly misleading key business decisions across multiple work streams.
The data team now faced the difficult task of correcting the logic. But more importantly, they had to restore trust.
How the Data Team Tackled the Problem
The data team started by exploring the assumptions baked into the original CLV calculation. They reviewed the SQL logic and quickly spotted two key issues:
- Order status filtering was missing. All orders were included—whether completed, in transit, or even pending return. But only
completedorders should have counted toward CLV. - Coupon discounts were treated as revenue, which overstated customer value. A $200 order using a 50% off coupon should be $100 of revenue. It counted as $200 of revenue. Oops.
The Step-by-Step Investigation
Step 1: Trace the code starting from customers.customer_lifetime_value
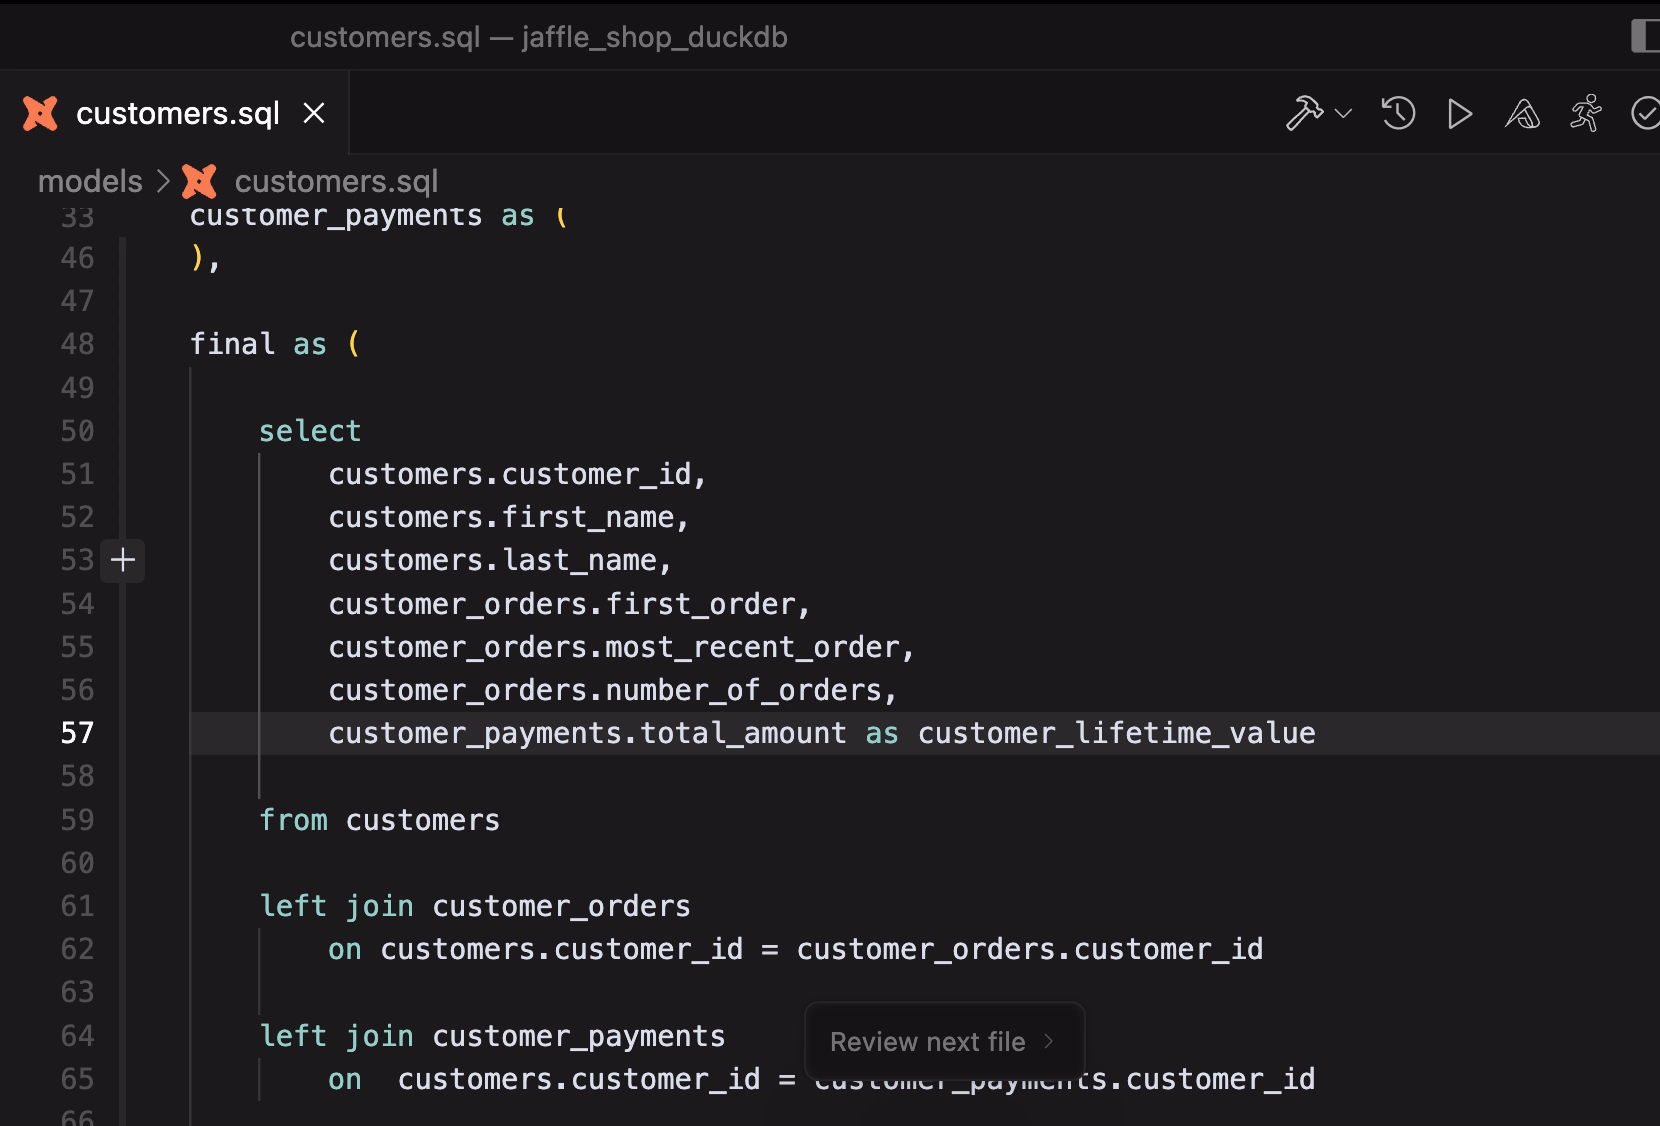
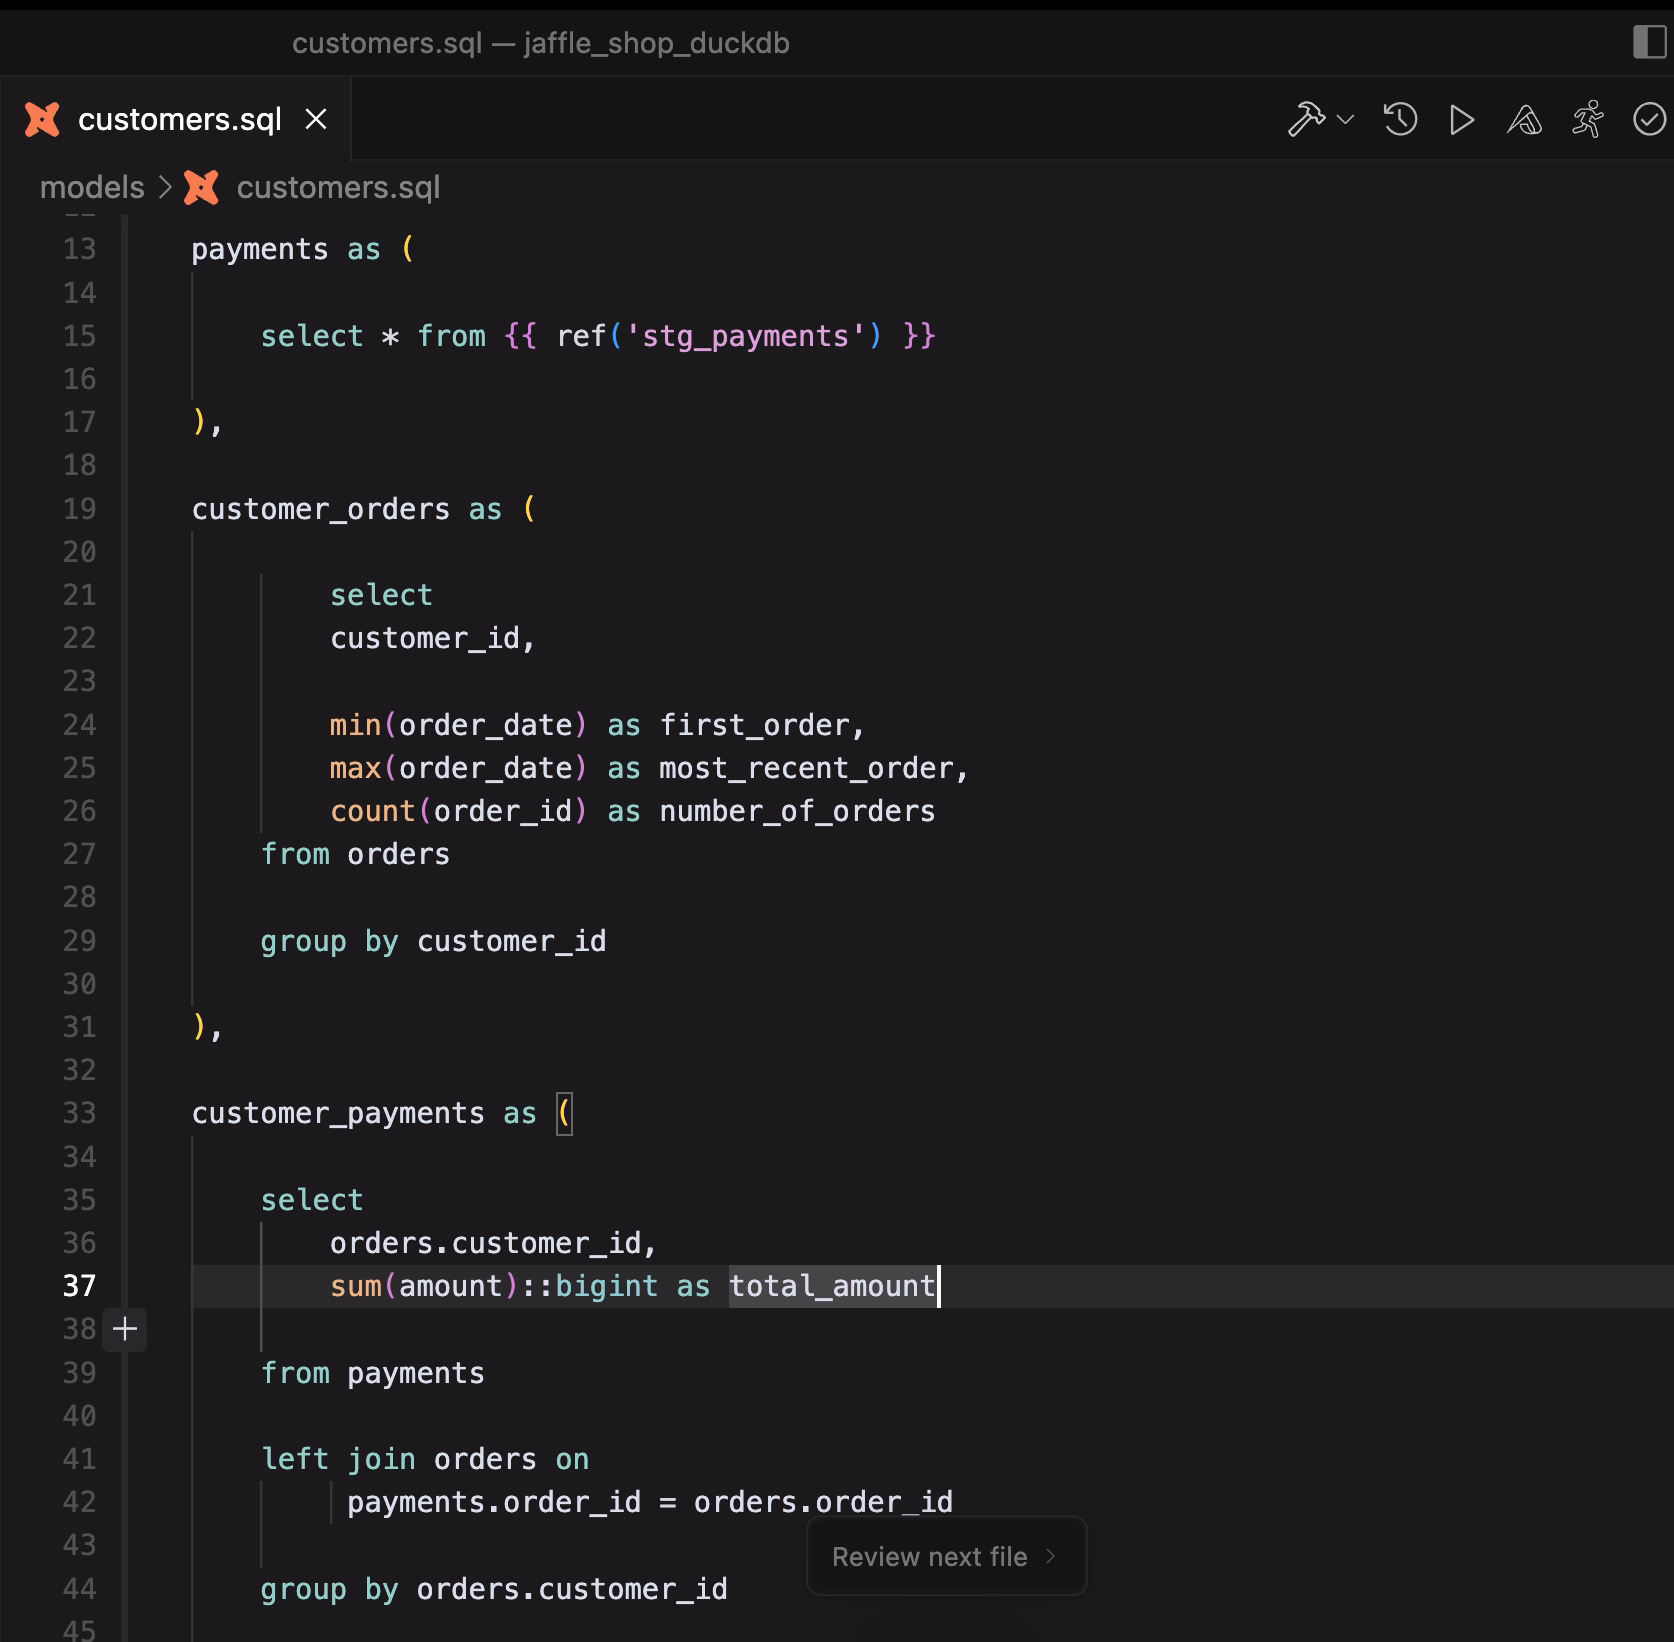
Step 2: Find that the total amount used for CLV came from the stg_payments model
Step 3: Validate whether the order status was contributing to inflated CLV by running a custom query against stg_orders to inspect which order statuses were included in customer_payments (which feed into CLV):
select status, count(order_id) as number_of_orders
from {{ ref("stg_orders") }}
group by 1
Step 4: Investigate if the payment_method could be the root cause of the revenue discrepancy by running another custom query:
select payment_method, sum(amount) as amount
 from {{ ref("stg_payments") }}
group by 1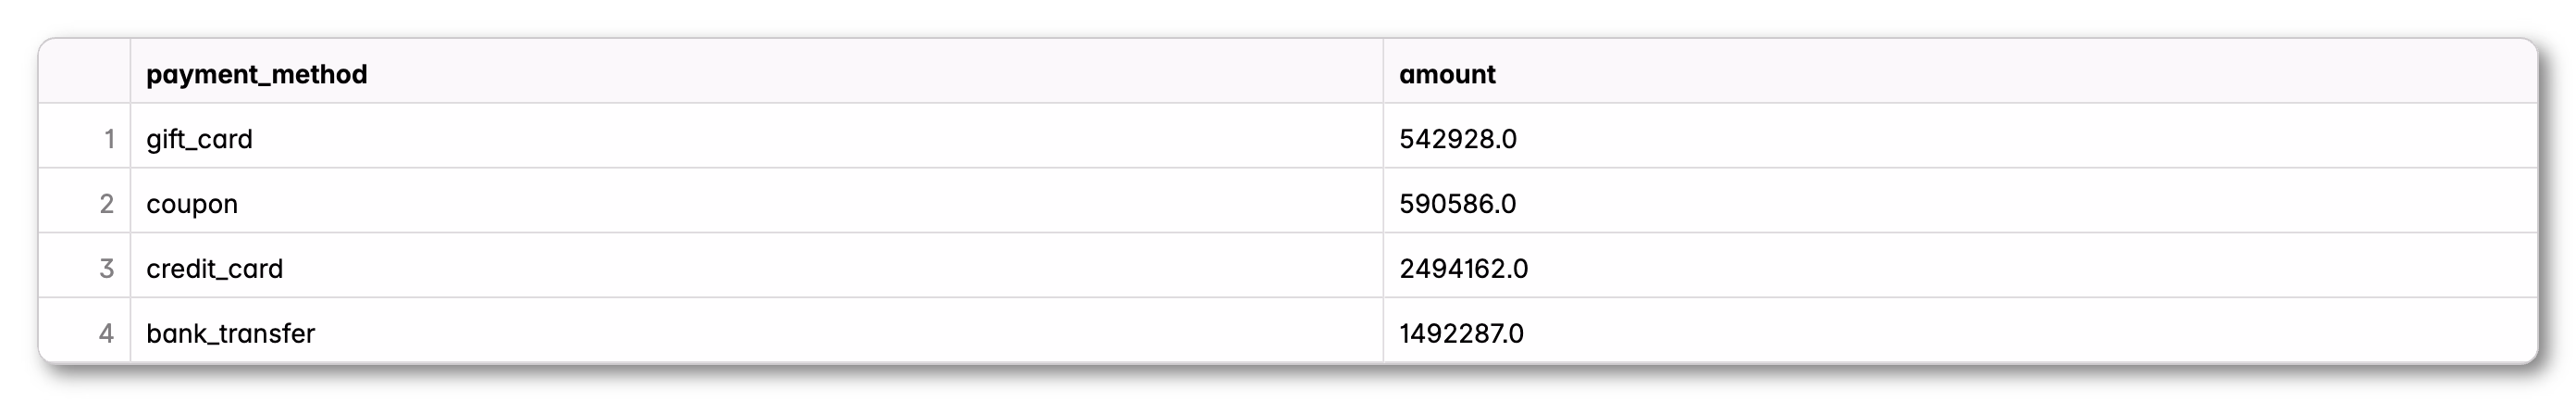
The process was slow, tedious, and prone to error. Just validating a single assumption meant digging through model files in an IDE, tracing SQL dependencies by hand, and running isolated queries in the data warehouse, but these findings confirmed the suspicion: CLV was being calculated on the wrong orders and the wrong money. 😱
What Took Hours, Now Takes 3 Clicks
With Recce, the same investigation can be done in just a few clicks:
-
Spot that the source of
customer_lifetime_valueisamountinstg_paymentsusing column-level lineage.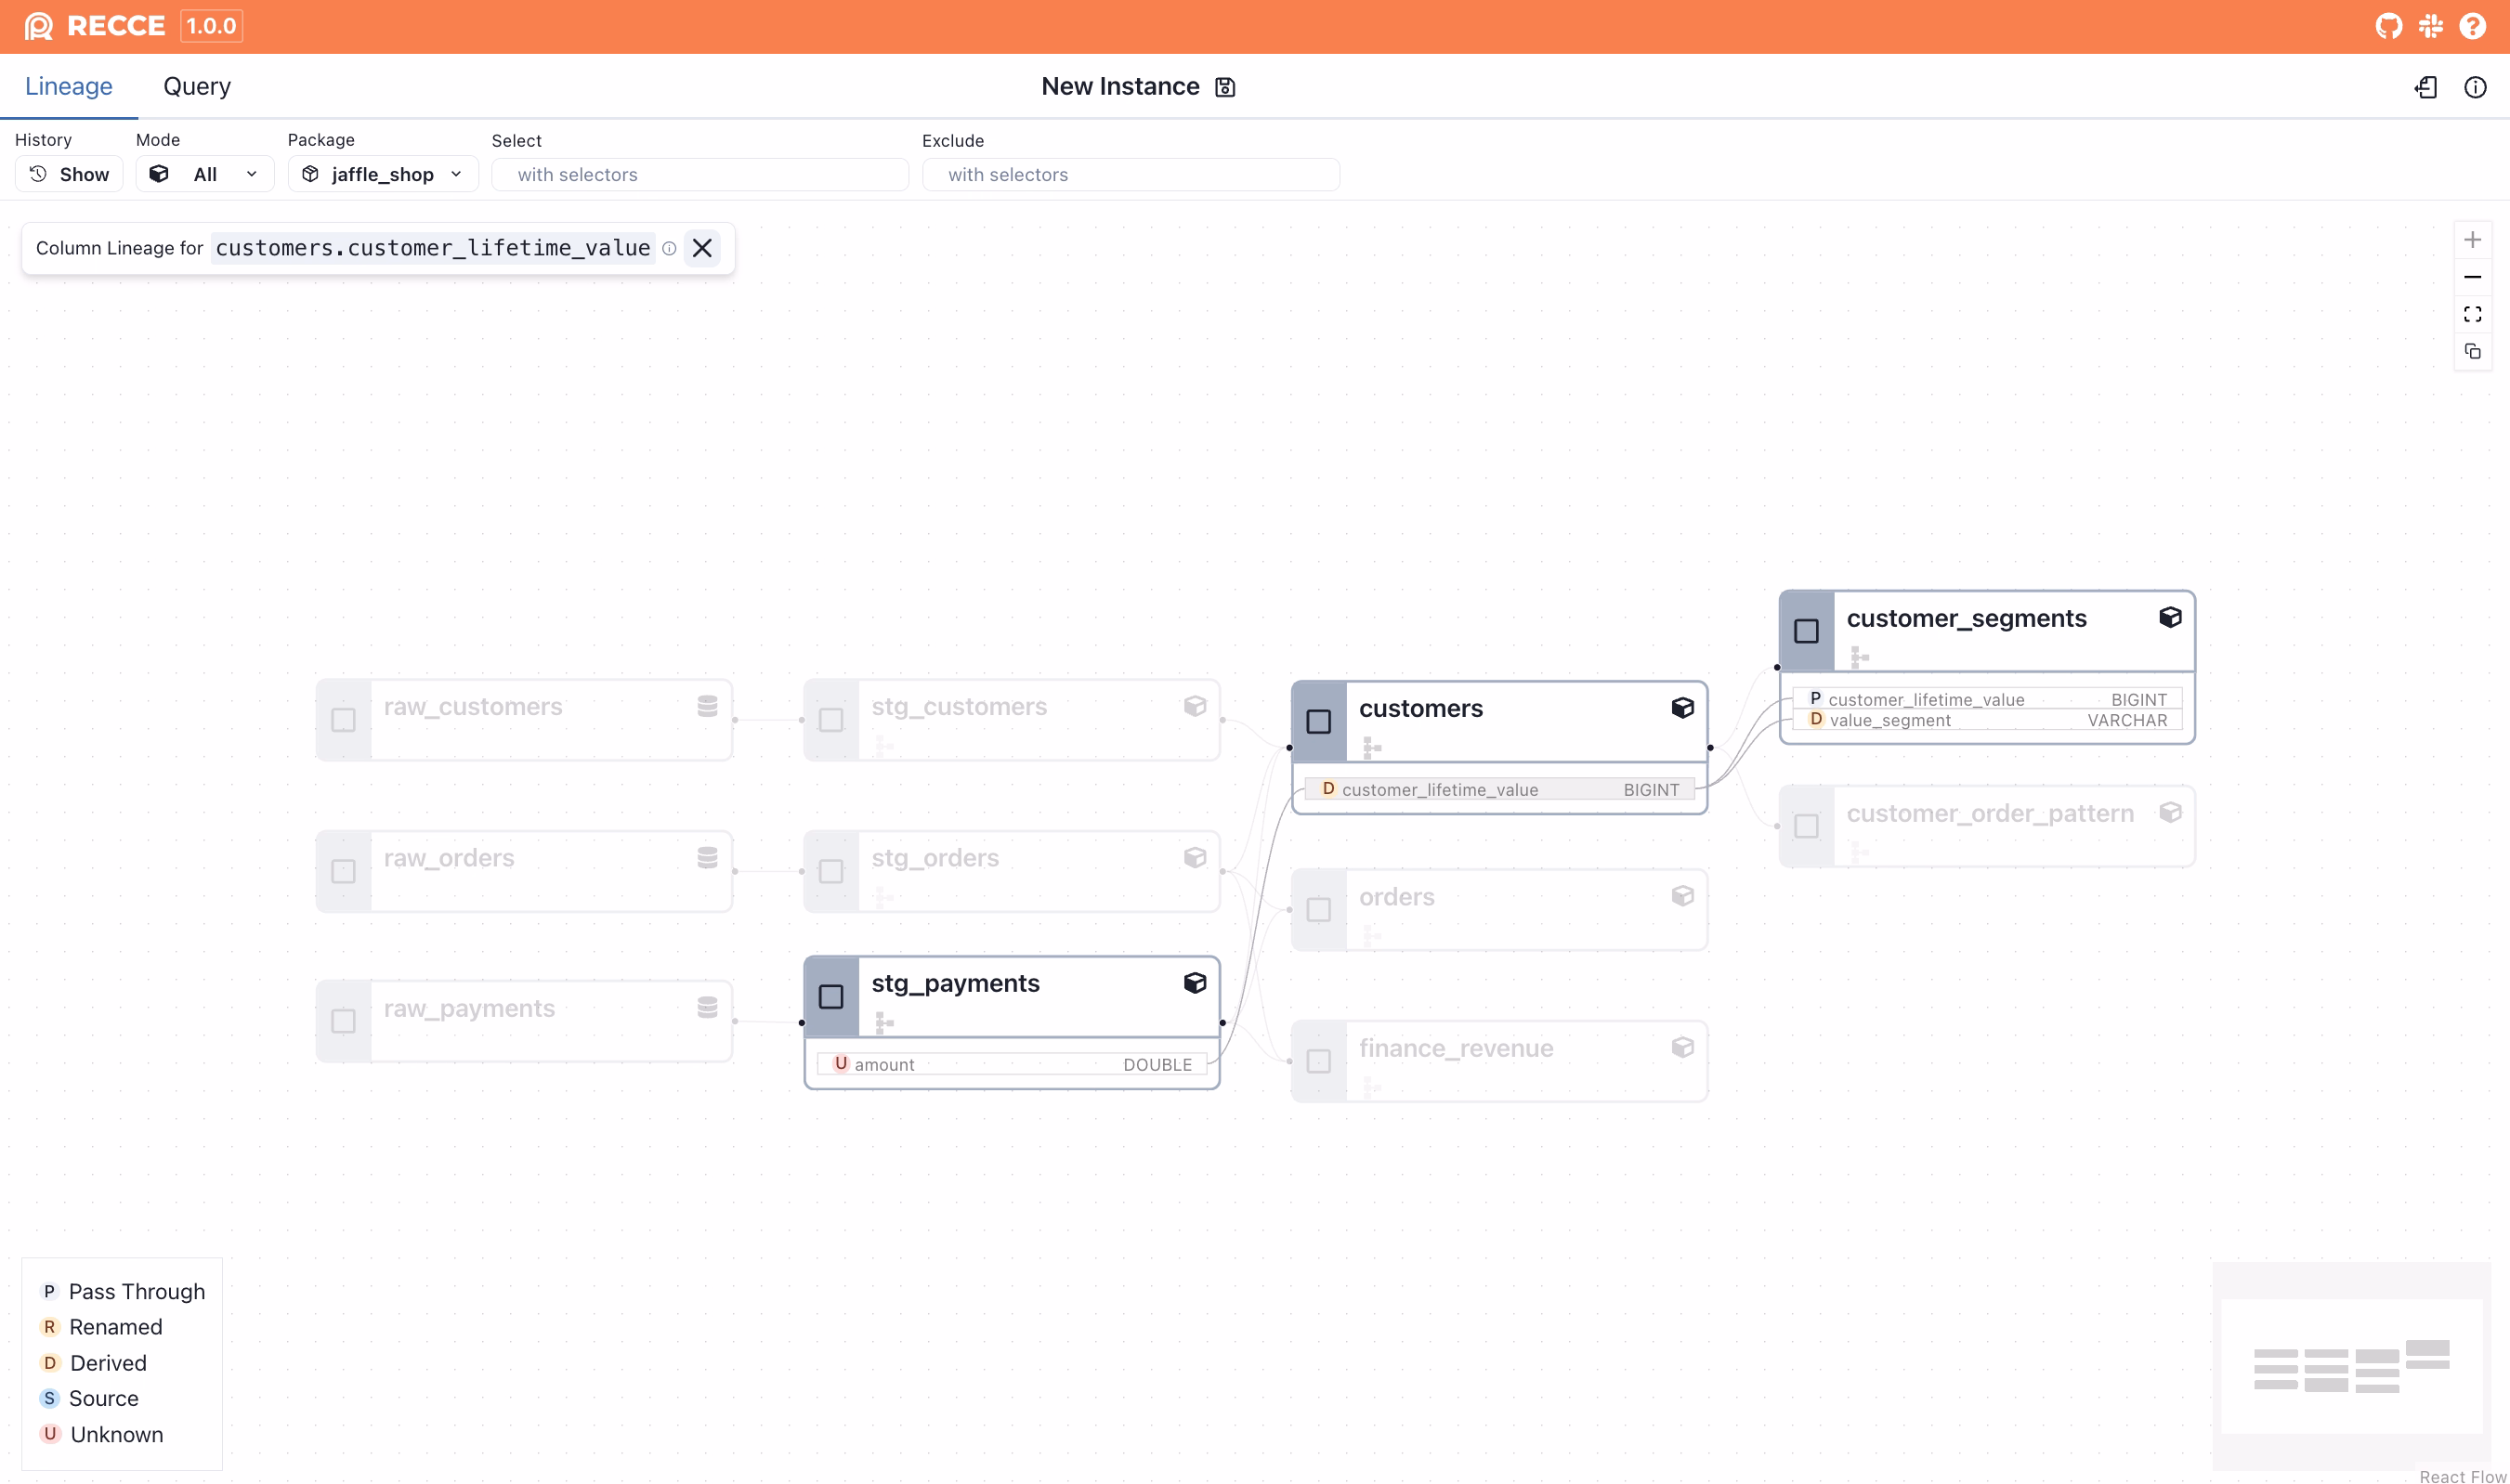
-
Inspect the
payment_methodfield instg_payments, revealing four different values, including coupon, a red flag 🚩 for inflated revenue.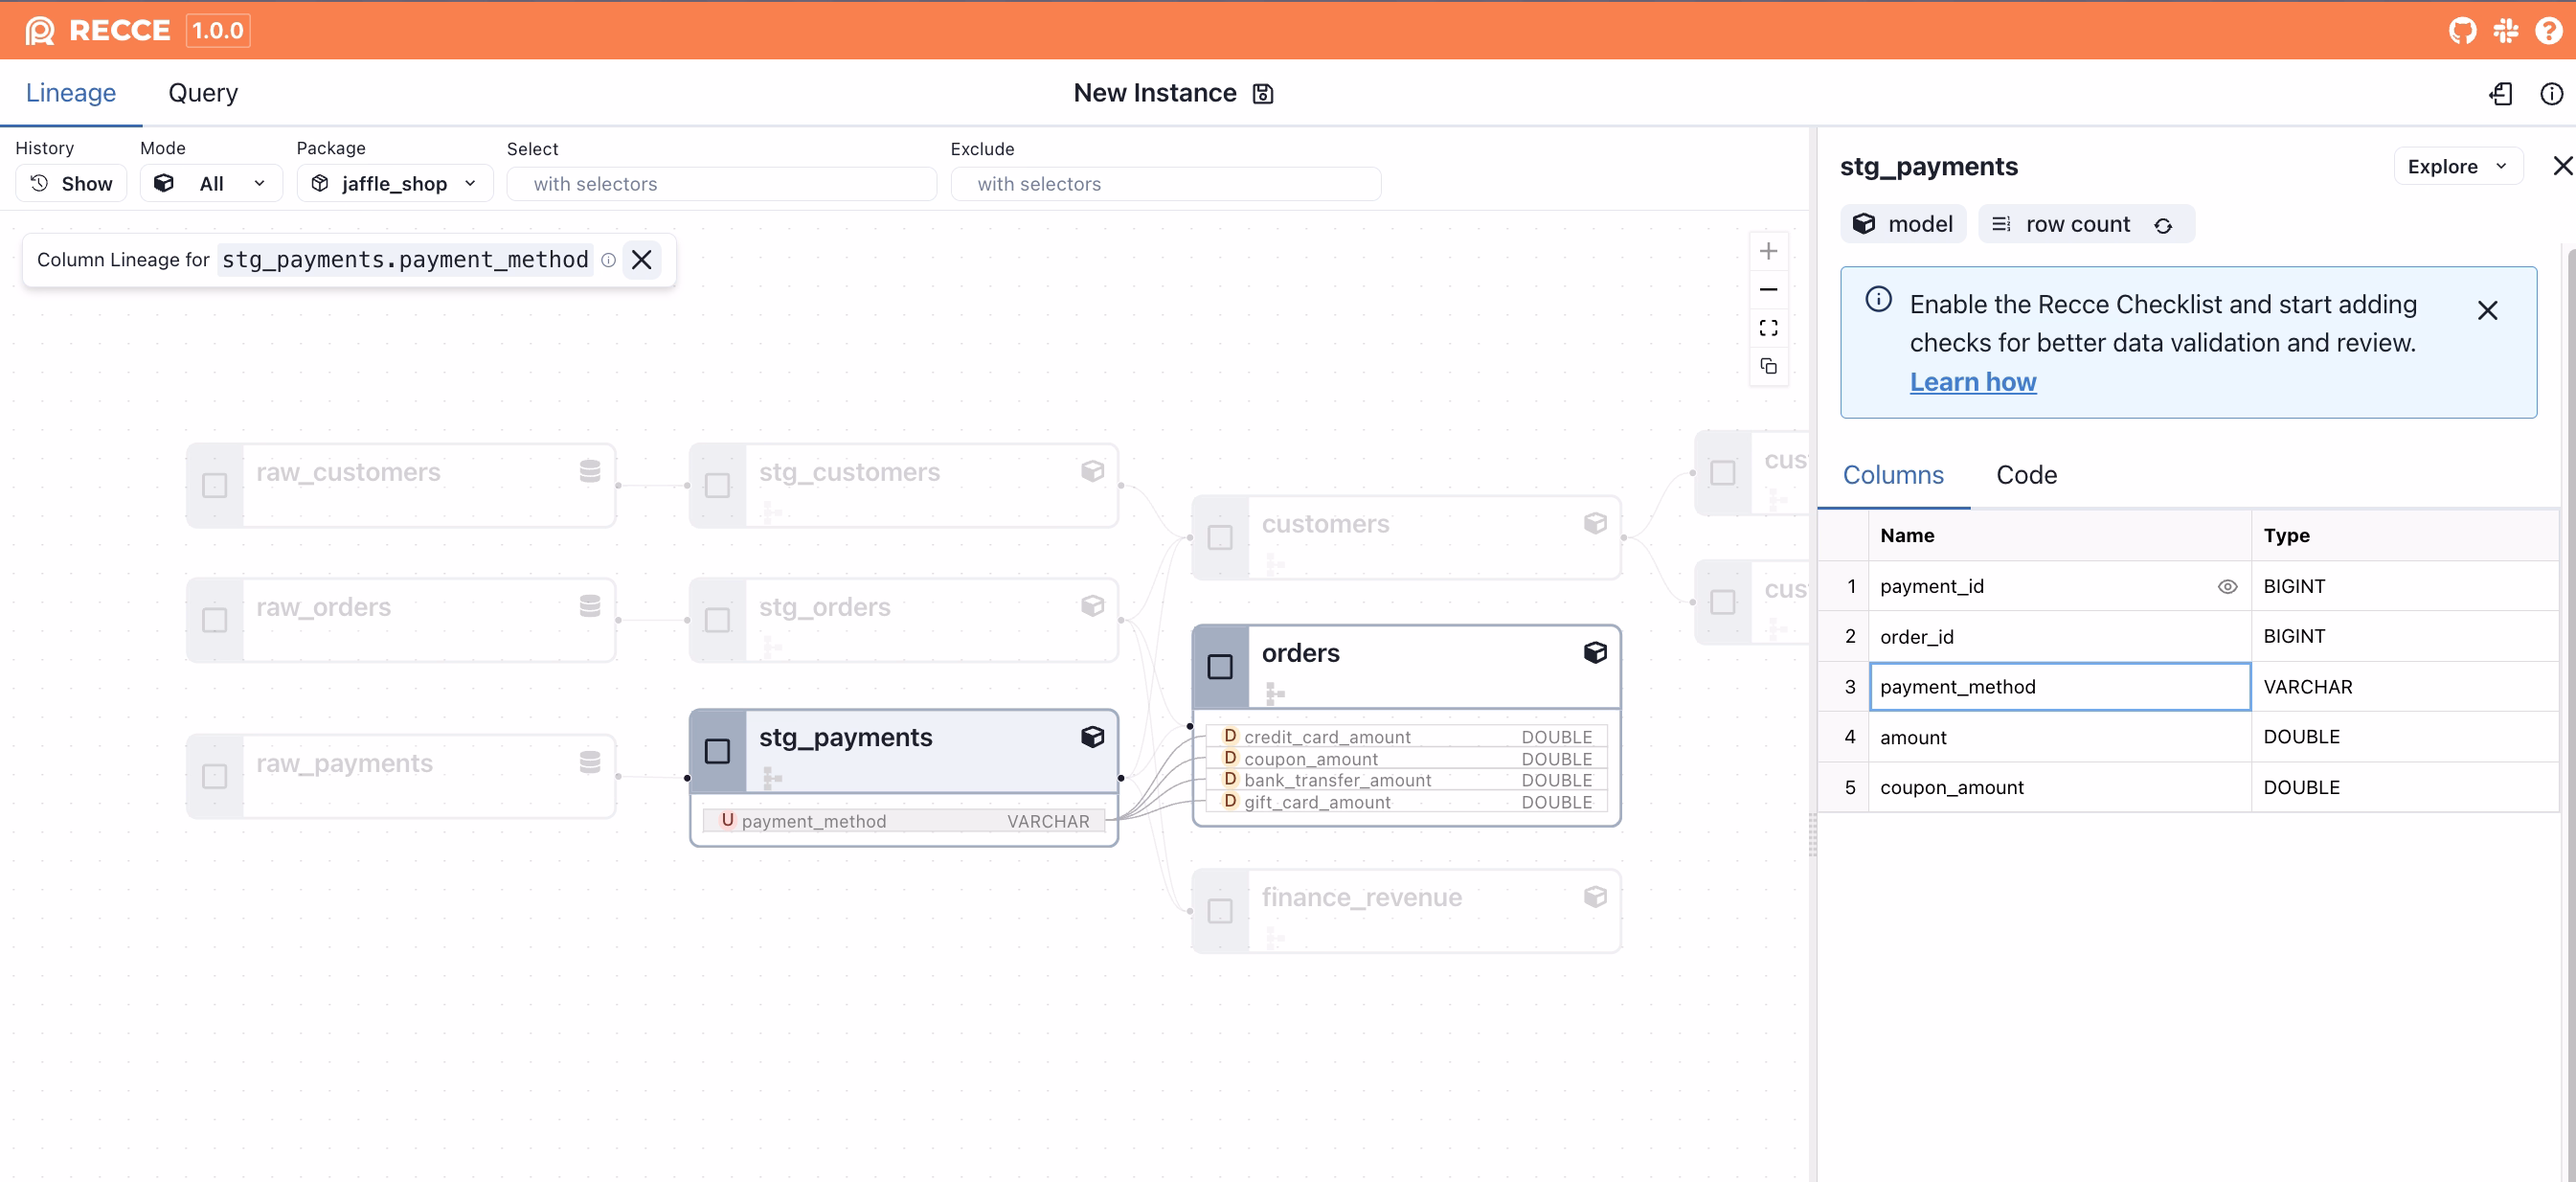
-
Query
orders.statusdirectly in Recce to confirm that unfulfilled orders were being counted in CLV. Drill intopayment_methodtotals to verify the coupon impact all without leaving Recce.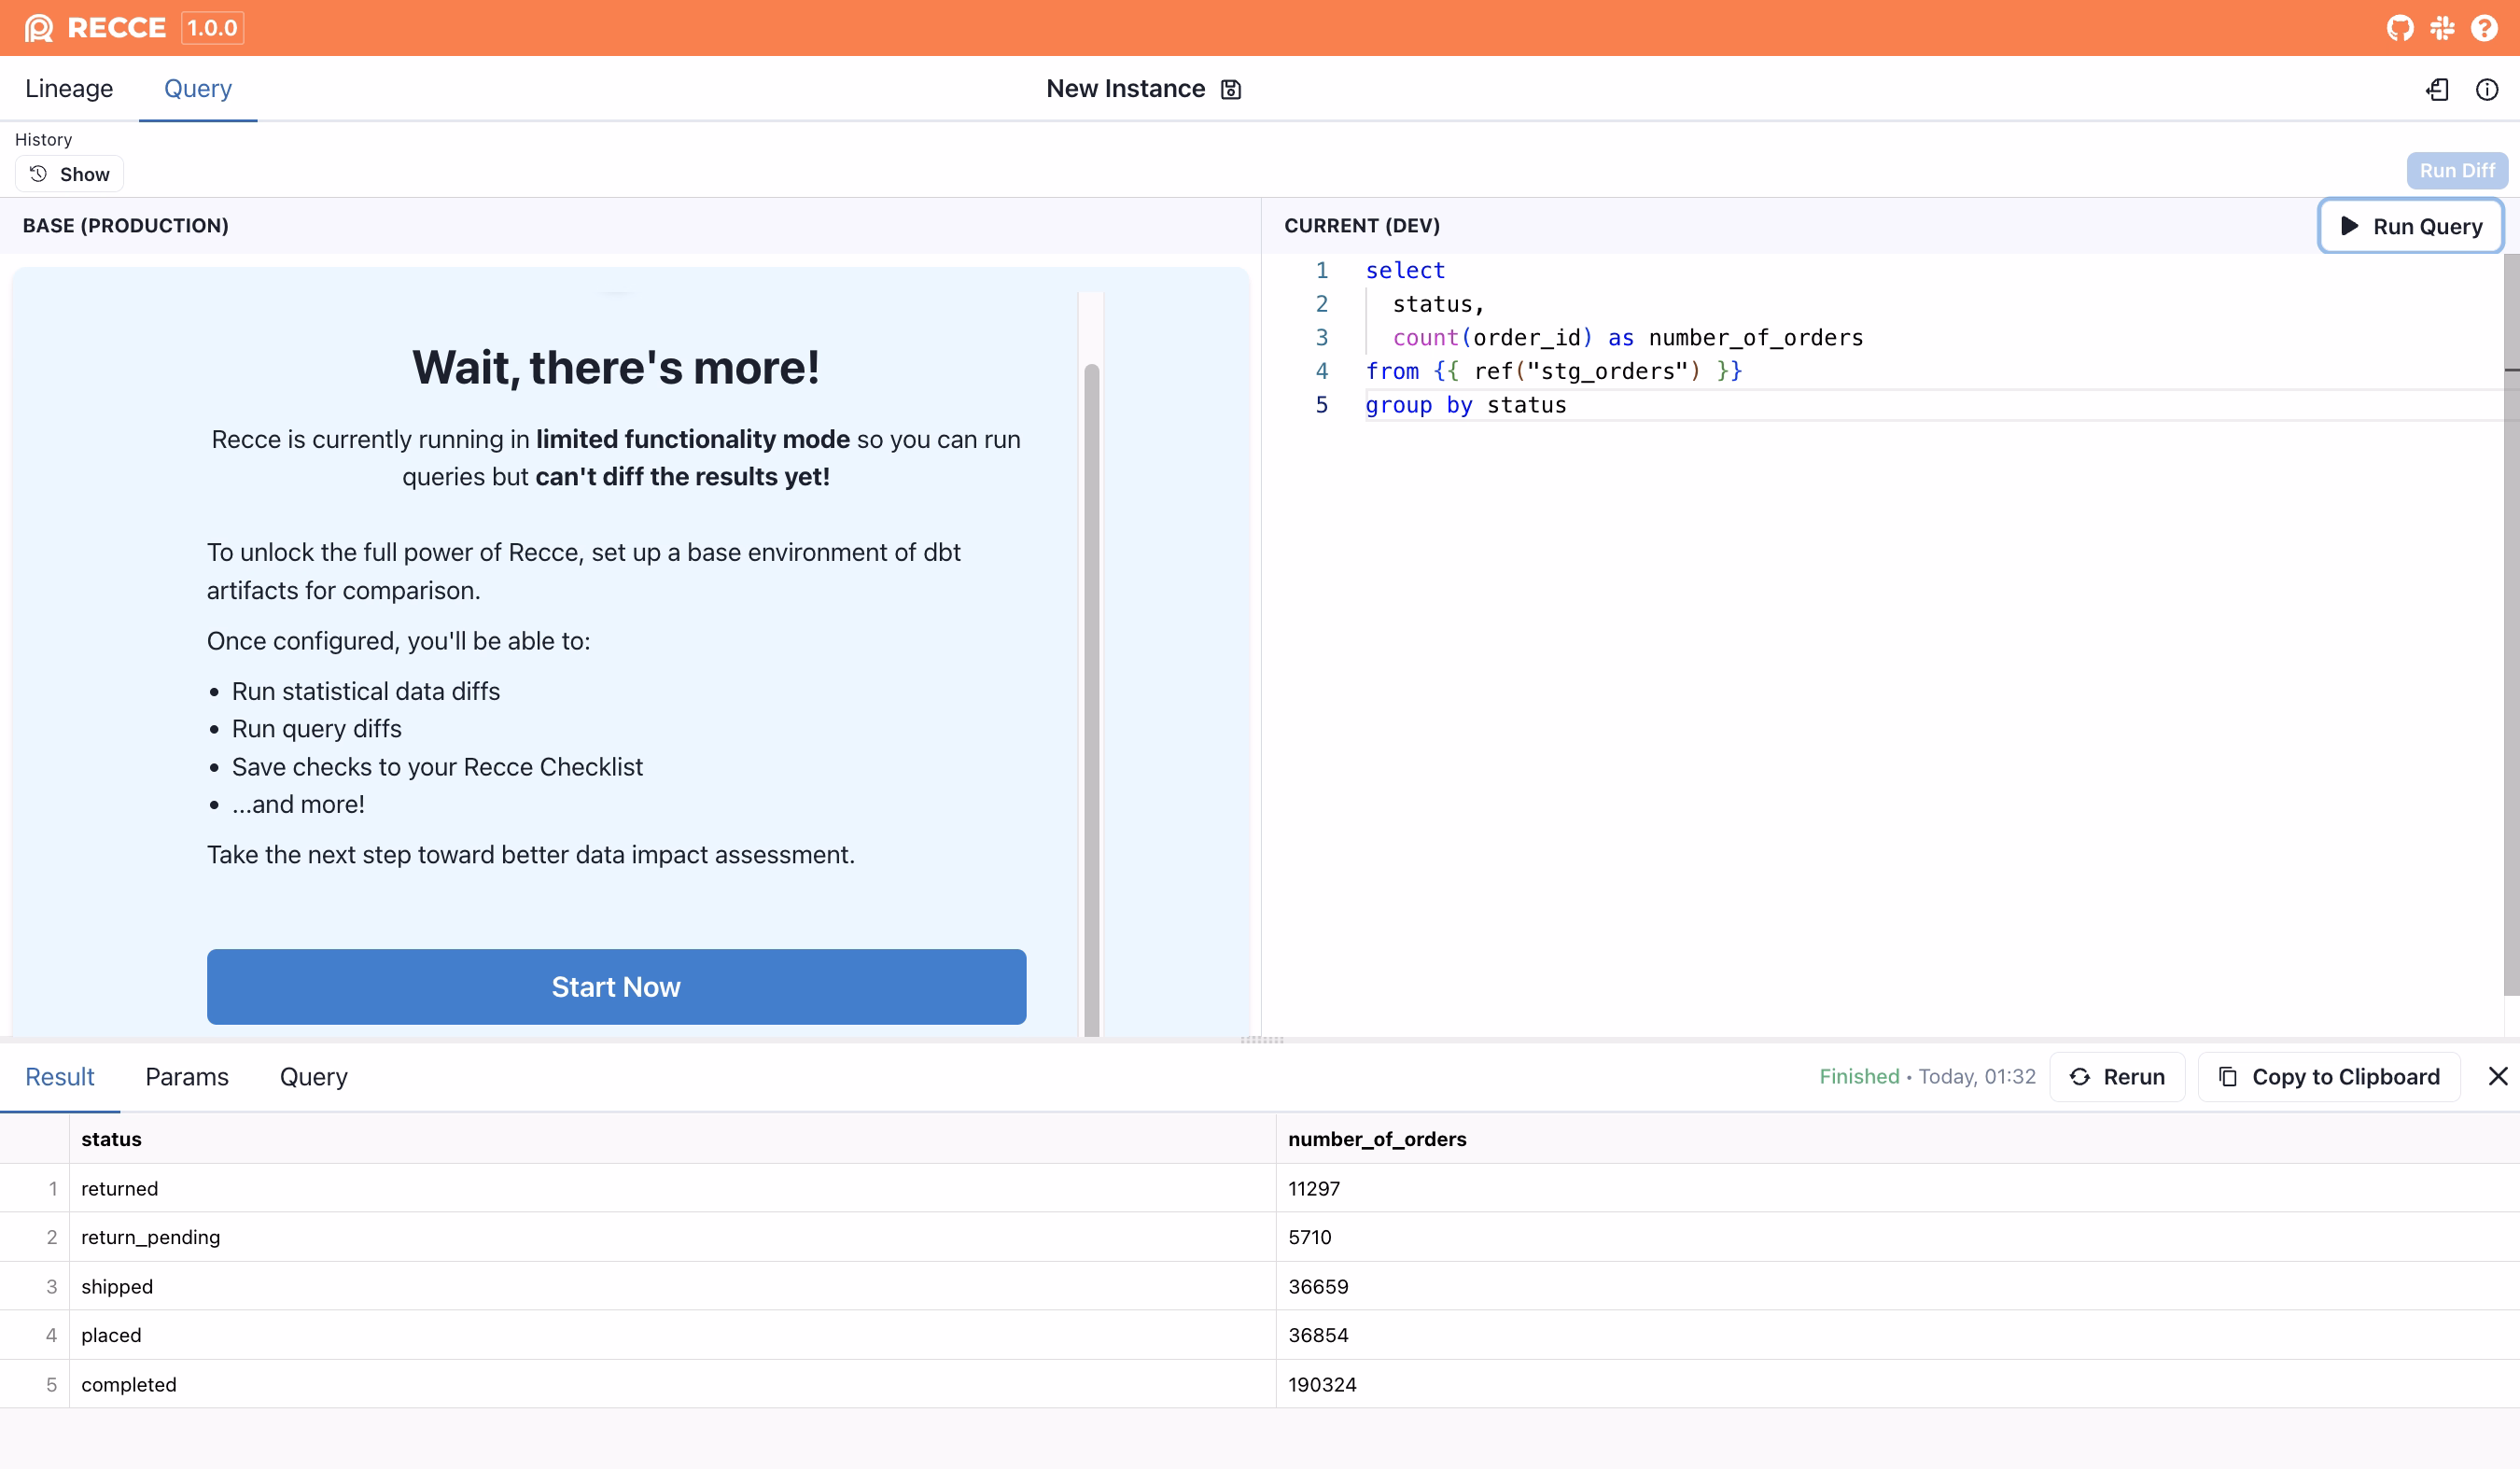

By eliminating the need to switch tools or manually piece things together, Recce helped the Jaffle Shop data team make the issue clear, explainable, and fixable. Fast.
How the Data Team Communicated and Validated the Solution
The data team knew this wasn’t just a technical fix, it was a critical change to core business metrics: CLV and revenue. Trust had already been shaken; both the marketing and finance teams were frustrated to learn that the numbers they had relied on for months were wrong.
To win back that trust, and avoid surprises or fire-fighting after deployment, the team made it a priority to help stakeholders understand the root cause and actively participate in validating the solution.
Instead of overwhelming everyone with SQL, the data team focused on evidence: two custom query results and a clear visual of model lineage. These artifacts helped explain what went wrong and why without diving into code. Once the teams aligned on the root cause, the data team introduced their proposed fix and walked through why it was the right solution, showing they had considered both business context and downstream impacts.
The solution the data team came up with had three parts:
-
Filter for completed orders only. All revenue and CLV calculations should consider only
completedorders to avoid inflating numbers with pending, shipped, or returned orders. -
Add a net CLV. In addition to the existing (gross) CLV, a new metric was introduced:
Net CLV = SUM(amount - coupon_amount). This allowed the marketing team to compare the new metric with what they previously used without breaking their dashboards. -
Create a finance revenue model. For finance, accuracy was critical. The team built a separate model to calculate net revenue based on actual cash inflow excluding all coupon amounts. Like CLV, it included both:
- Gross Revenue: total order amount
- Net Revenue: total order amount, excluding coupon amounts
This ensured clean, reliable numbers for reporting, compliance, and financial planning completely independent of marketing metrics.
But how do they communicate changes to stakeholders who don’t use GitHub, or can’t or don’t want to review SQL logic? That challenge shaped how the fix was validated and shared.
The Step-by-Step Validation
Step 1. Manually trace dependencies. By spending hours tracing dependencies from customer_lifetime_value upstream to stg_payments and downstream to customer_segments, this investigation helped surface the assumptions baked into the original metric logic and clarified where the incorrect values were coming from.
- Compare metrics before and after filtering for completed orders. The team wrote an ad hoc query to compare CLV and revenue values before and after applying the correct filters (
status = 'completed') and subtracting coupon amounts.

This helped confirm that:
- Original metrics included all order statuses
- Coupons were being miscounted as revenue
with customers as (
    select *  from {{ ref('stg_customers') }}
),

orders as (
    select * from {{ ref('stg_orders') }}
),

payments as (
    select
        *,
        -- New: coupon_amount, 0 if not a coupon
         (payment_method = 'coupon')::int * (amount / 100) as coupon_amount
    from {{ ref('stg_payments') }}
),

-- BEFORE FIX: uses all orders, does not subtract coupon
customer_payments_before as (
    select
        orders.customer_id,
        sum(amount)::bigint as gross_before,
        sum(amount - coupon_amount)::bigint as net_before  -- same as gross (incorrect)
    from payments
    left join orders on payments.order_id = orders.order_id
    group by orders.customer_id
),

-- AFTER FIX: uses only completed orders, subtracts coupon
customer_payments_after as (
    select
        orders.customer_id,
        sum(amount)::bigint as gross_after,
        sum(amount - coupon_amount)::bigint as net_after
    from payments
    left join orders on payments.order_id = orders.order_id
    where orders.status = 'completed'
    group by orders.customer_id
)

select
    sum(b.gross_before) as total_amount_before,         -- includes all orders, includes coupons
    sum(a.gross_after) as total_completed_amount_after,           -- only completed orders, includes coupons

    sum(b.net_before) as total_revenue_before,
    sum(a.net_after) as total_net_revenue_after      -- only completed orders, excludes coupons

from customers c
left join customer_payments_before b on c.customer_id = b.customer_id
left join customer_payments_after a on c.customer_id = a.customer_id- Show CLV before & after at the customer level. To make the fix tangible, the team built a side-by-side view of
customer_id,gross_before,gross_after,profit_before, andprofit_after. This helped stakeholders spot-check high-value customers and understand the business impact. They also generated:- Top 5 most affected customers
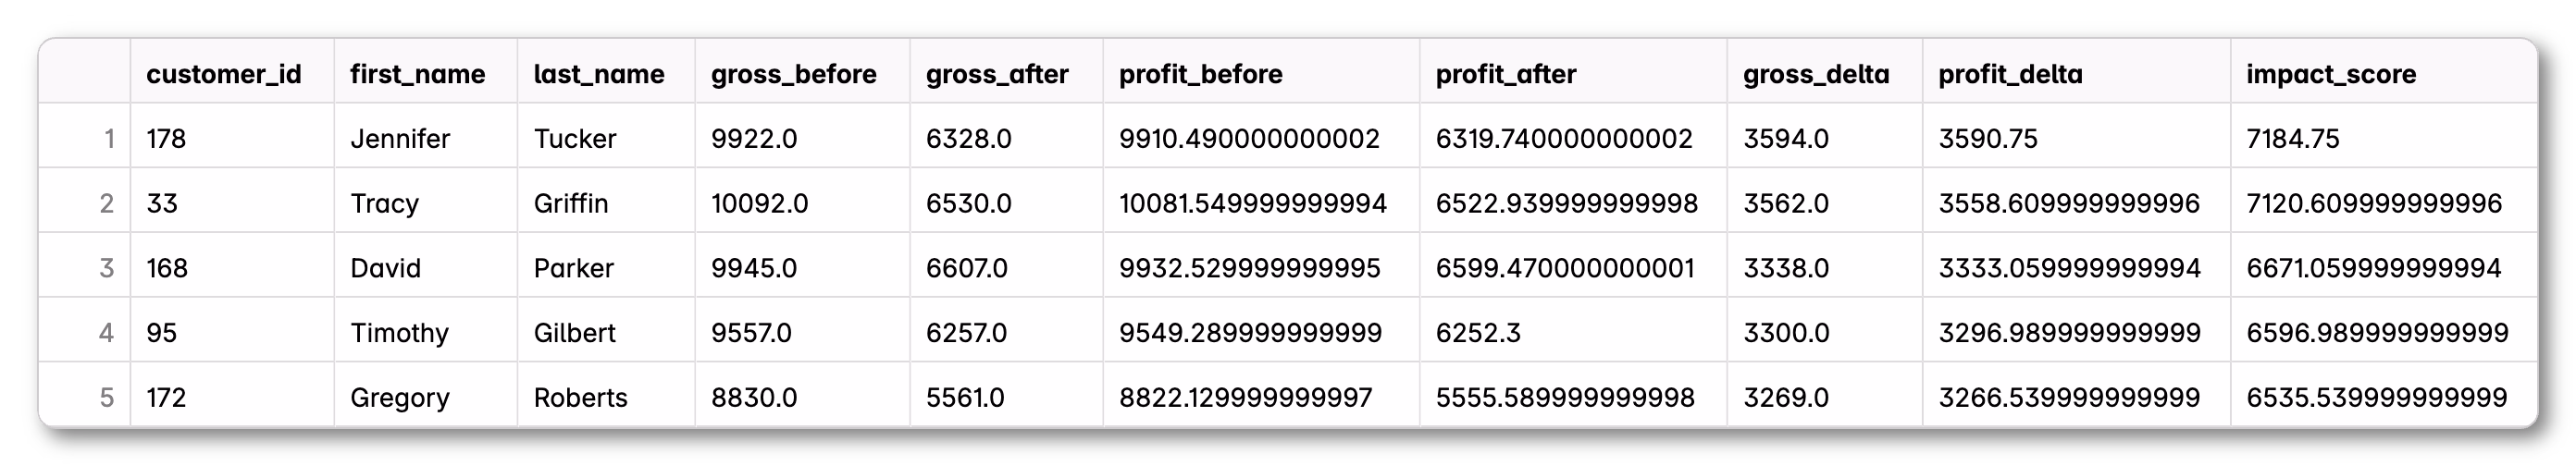
- Top 5 highest CLV (gross) before
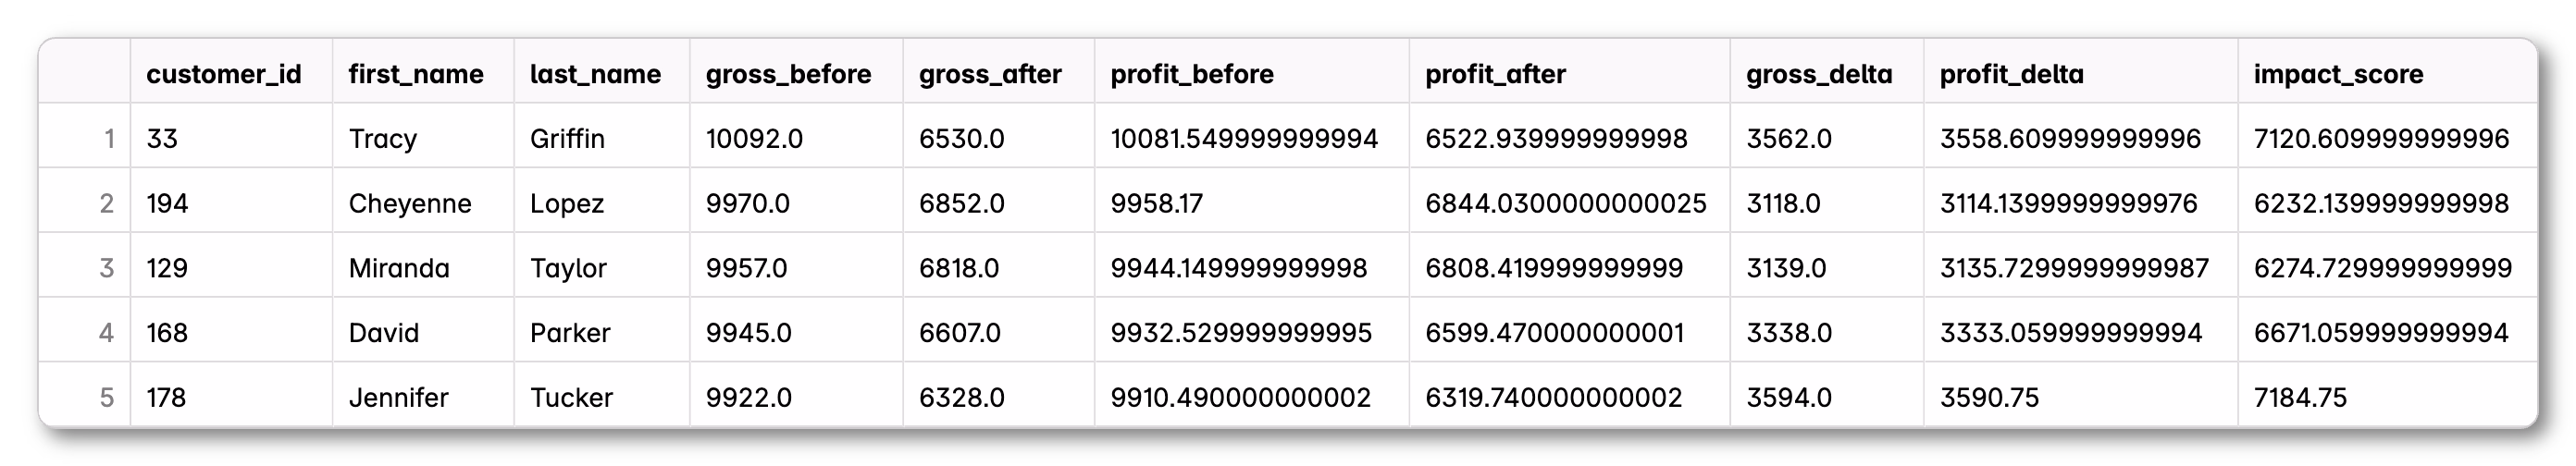
- Top 5 highest CLV (net) after
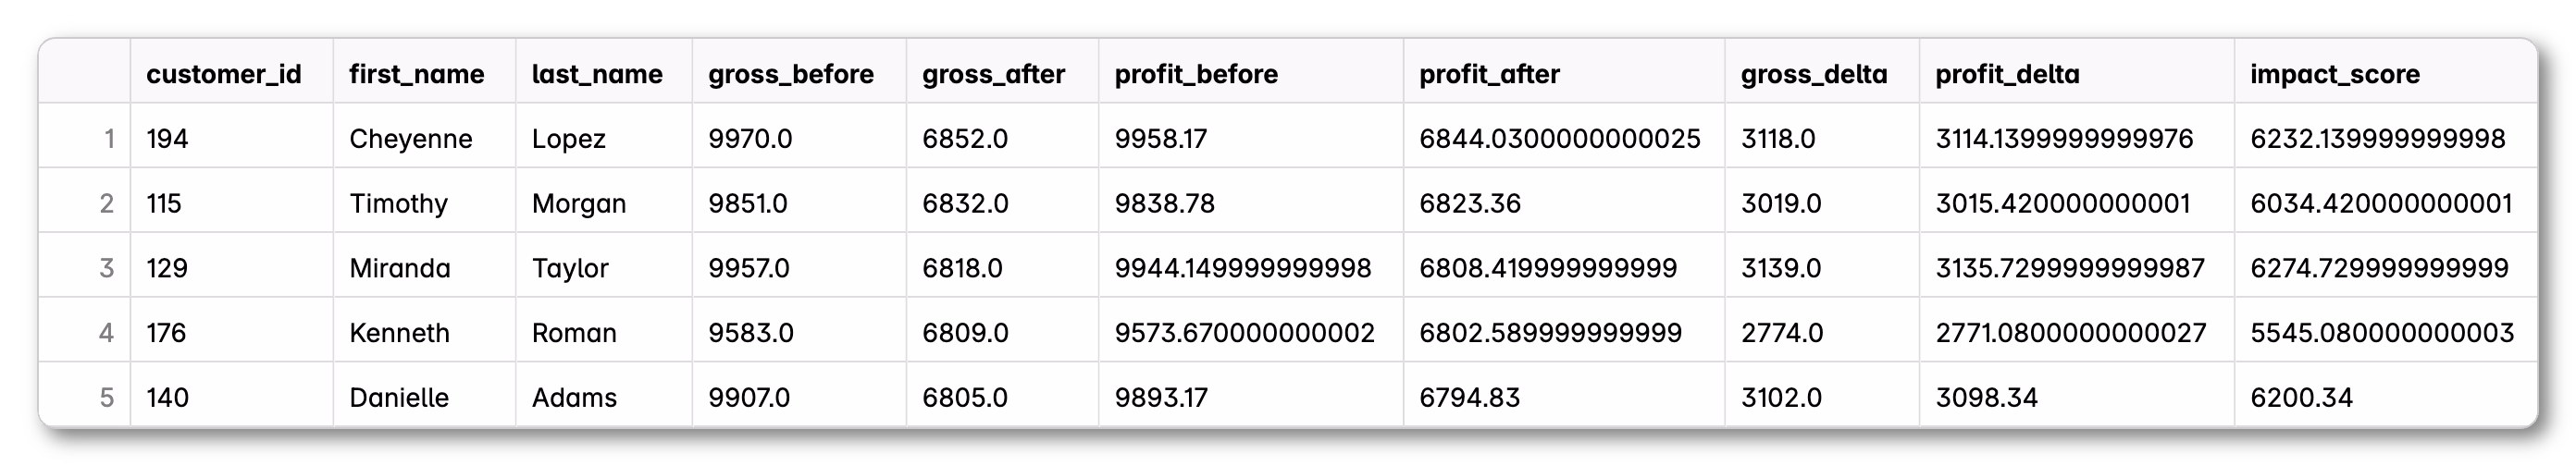
- Top 5 most affected customers
with customers as (
    select * from {{ ref('stg_customers') }}
),

orders as (
    select * from {{ ref('stg_orders') }}
),

payments as (
    select
        *,
        (payment_method = 'coupon')::int * (amount / 100) as coupon_amount
    from {{ ref('stg_payments') }}
),

-- BEFORE FIX: includes all orders, does not filter by status
customer_payments_before as (
    select
        orders.customer_id,
        sum(amount) as gross_before,
        sum(amount - coupon_amount) as profit_before
    from payments
    left join orders on payments.order_id = orders.order_id
    group by orders.customer_id
),

-- AFTER FIX: includes only completed orders, subtracts coupon
customer_payments_after as (
    select
        orders.customer_id,
        sum(amount) as gross_after,
        sum(amount - coupon_amount) as profit_after
    from payments
    left join orders on payments.order_id = orders.order_id
	      and orders.status = 'completed'
    where payments.amount is not null -- Exclude incomplete payments
        and payments.amount > 0
    group by orders.customer_id
)

select
    b.customer_id,
    c.first_name,
    c.last_name,
    b.gross_before,
    a.gross_after,
    b.profit_before,
    a.profit_after,
    (b.gross_before - a.gross_after) as gross_delta,
    (b.profit_before - a.profit_after) as profit_delta,
    abs(b.gross_before - a.gross_after) + abs(b.profit_before - a.profit_after) as impact_score
from customer_payments_before b
join customer_payments_after a on b.customer_id = a.customer_id
join customers c on c.customer_id = b.customer_id
order by impact_score desc
limit 5-
Trace all downstream impact before the fix. When fixing CLV, the data team modified three models:
customers,customer_order_pattern, andfinance_revenue. That meant any downstream model depending on any of the three needed to be reviewed for potential breakage. The team had to answer a tough question: 👉 Which models and dashboards could break if we merge this PR?To answer it, they had to:
- Expand all downstream models, eventually reviewing four in total.
- Cross-check whether any models used columns like
customer_lifetime_value,number_of_orders, or revenue fields. - Identify indirect dependencies, like
customer_segments, that combine metrics from bothcustomersandcustomer_order_pattern.
⚠️ This step was slow and fragile. It required opening multiple SQL files, mentally tracing joins and references, and keeping track of how logic flowed across models. The process was time-consuming and highly prone to human error, especially when logic was deeply nested or reused across layers.
-
Show the impact to
customer_segments- Value segment shifts. The team validated whether the
value_segmentdefinitions still held up or even improved. By comparing the segment assigned based on the original CLV (gross) to the one based on the corrected CLV (net), they highlighted how many customers shifted between tiers and the average CLV values in each.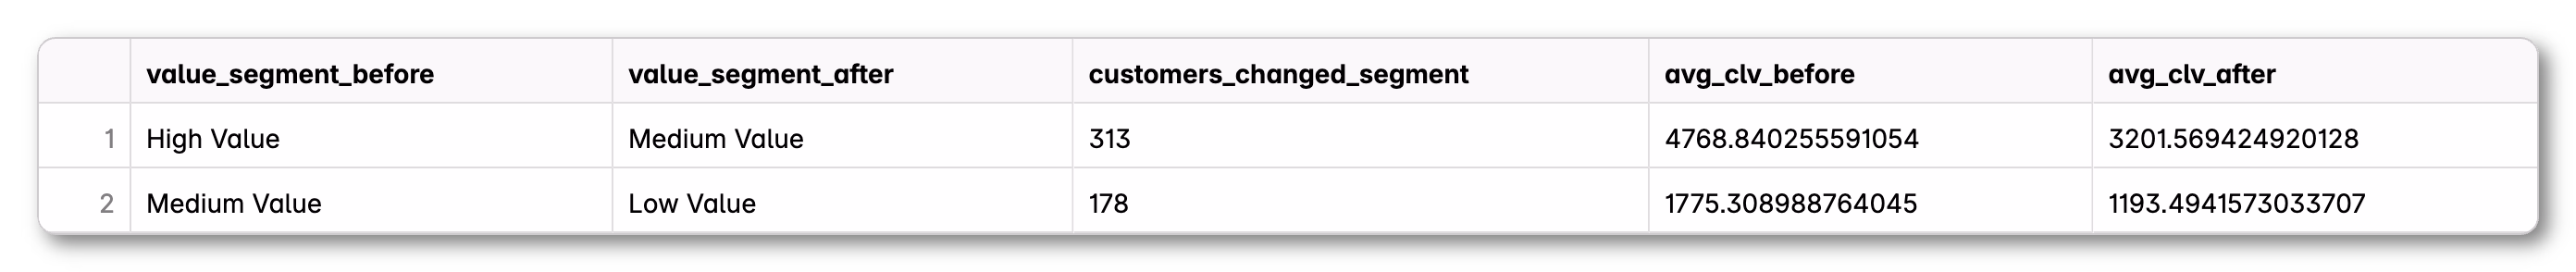
- Value segment shifts. The team validated whether the
   with orders as (
    select * from {{ ref('stg_orders') }}
),

payments as (
    select
        *,
        (payment_method = 'coupon')::int * (amount / 100) as coupon_amount
    from {{ ref('stg_payments') }}
),

-- BEFORE FIX: includes all orders, coupons included
customer_payments_before as (
    select
        orders.customer_id,
        sum(amount) as customer_lifetime_value
    from payments
    left join orders on payments.order_id = orders.order_id
    group by orders.customer_id
),

-- AFTER FIX: includes only completed orders, coupons excluded
customer_payments_after as (
    select
        orders.customer_id,
        sum(amount - coupon_amount) as net_customer_lifetime_value
    from payments
    left join orders on payments.order_id = orders.order_id
		    and orders.status = 'completed'
    where payments.amount is not null -- Exclude incomplete payments
        and payments.amount > 0
    group by orders.customer_id
),

-- Combine and apply segmentation logic
combined as (
    select
        b.customer_id,
        b.customer_lifetime_value,
        a.net_customer_lifetime_value,

        -- Value segment before (gross CLV)
        case
            when b.customer_lifetime_value > 4000 then 'High Value'
            when b.customer_lifetime_value between 1500 and 4000 then 'Medium Value'
            else 'Low Value'
        end as value_segment_before,

        -- Value segment after (net CLV)
        case
            when a.net_customer_lifetime_value > 4000 then 'High Value'
            when a.net_customer_lifetime_value between 1500 and 4000 then 'Medium Value'
            else 'Low Value'
        end as value_segment_after

    from customer_payments_before b
    join customer_payments_after a on b.customer_id = a.customer_id
)

-- Compare segment shifts + average values
select
    value_segment_before,
    value_segment_after,
    count(*) as customers_changed_segment,
    avg(customer_lifetime_value) as avg_clv_before,
    avg(net_customer_lifetime_value) as avg_clv_after
from combined
where value_segment_before != value_segment_after
group by value_segment_before, value_segment_after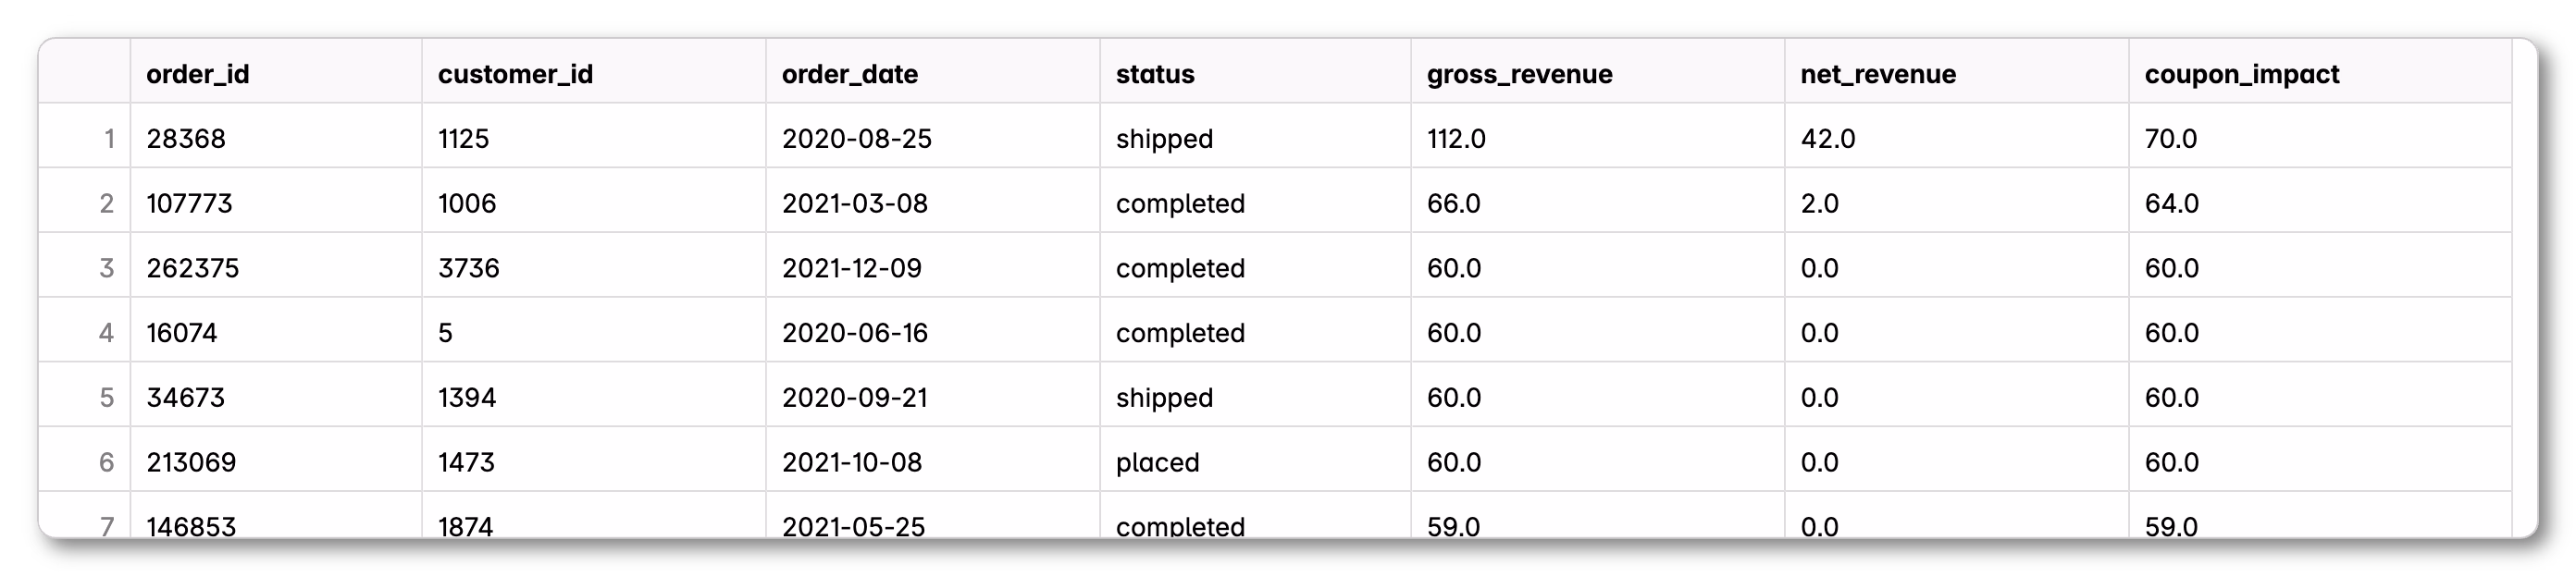
order by customers_changed_segment desc- Validate the new finance_revenue model. To help the finance team understand that gross revenue remained unchanged—allowing them to retain historical comparisons—and that net_revenue is a new, complementary field, the data team wrote a SQL query that replicated the logic in the finance_revenue model. This produced a side-by-side comparison of both metrics at the order level, highlighting the coupon impact per order.
-- Manual revenue comparison query for finance

with payments as (
   select
       order_id,
       amount,
       case
           when payment_method = 'coupon' then amount
           else 0
       end as coupon_amount
   from {{ ref('stg_payments') }}
),
revenue_by_order as (
   select
       order_id,
       sum(amount) as gross_revenue,
       sum(amount - coupon_amount) as net_revenue
   from payments
   group by order_id
),
orders as (
   select
       order_id,
       customer_id,
       order_date,
       status
   from {{ ref('stg_orders') }}
)
select
   o.order_id,
   o.customer_id,
   o.order_date,
   o.status,
   r.gross_revenue,
   r.net_revenue,
   (r.gross_revenue - r.net_revenue) as coupon_impact
from orders o
left join revenue_by_order r on o.order_id = r.order_id
order by coupon_impact desc
To validate their fix, the data team wrote a series of complex, custom queries that compared “before” and “after” metrics side by side. This helped surface the impact at the customer and order level.
But it wasn’t enough.
Stakeholders still asked for CSV exports to verify individual rows in Excel. Preparing those exports took time, and interpreting them wasn’t easy for non-technical teams. The resulting files were large, so validation relied on spot-checking, eye-balling, or using Excel formulas to filter and inspect specific rows. 😓 Both the data team and stakeholders spent hours validating a single fix, and the process still left room for things to be missed.
With Recce, Validation Is Streamlined and Trust Is Rebuilt
The data team didn’t just fix broken metrics. By making their decisions transparent and easy to follow, they brought stakeholders into the process, and in doing so, earned back the trust of both marketing and finance.
Recce streamlines the entire validation process, turning complex root cause investigations into structured, visual, and explainable steps.
- Trace dependencies instantly. What used to take hours of manual SQL tracing can now be done in three clicks using column-level lineage and query.
- Compare customer metrics before and after the fix with one click. A single click on the
customersmodel’s Profile Diff reveals how filtering forcompletedorders and excluding coupons affects CLV.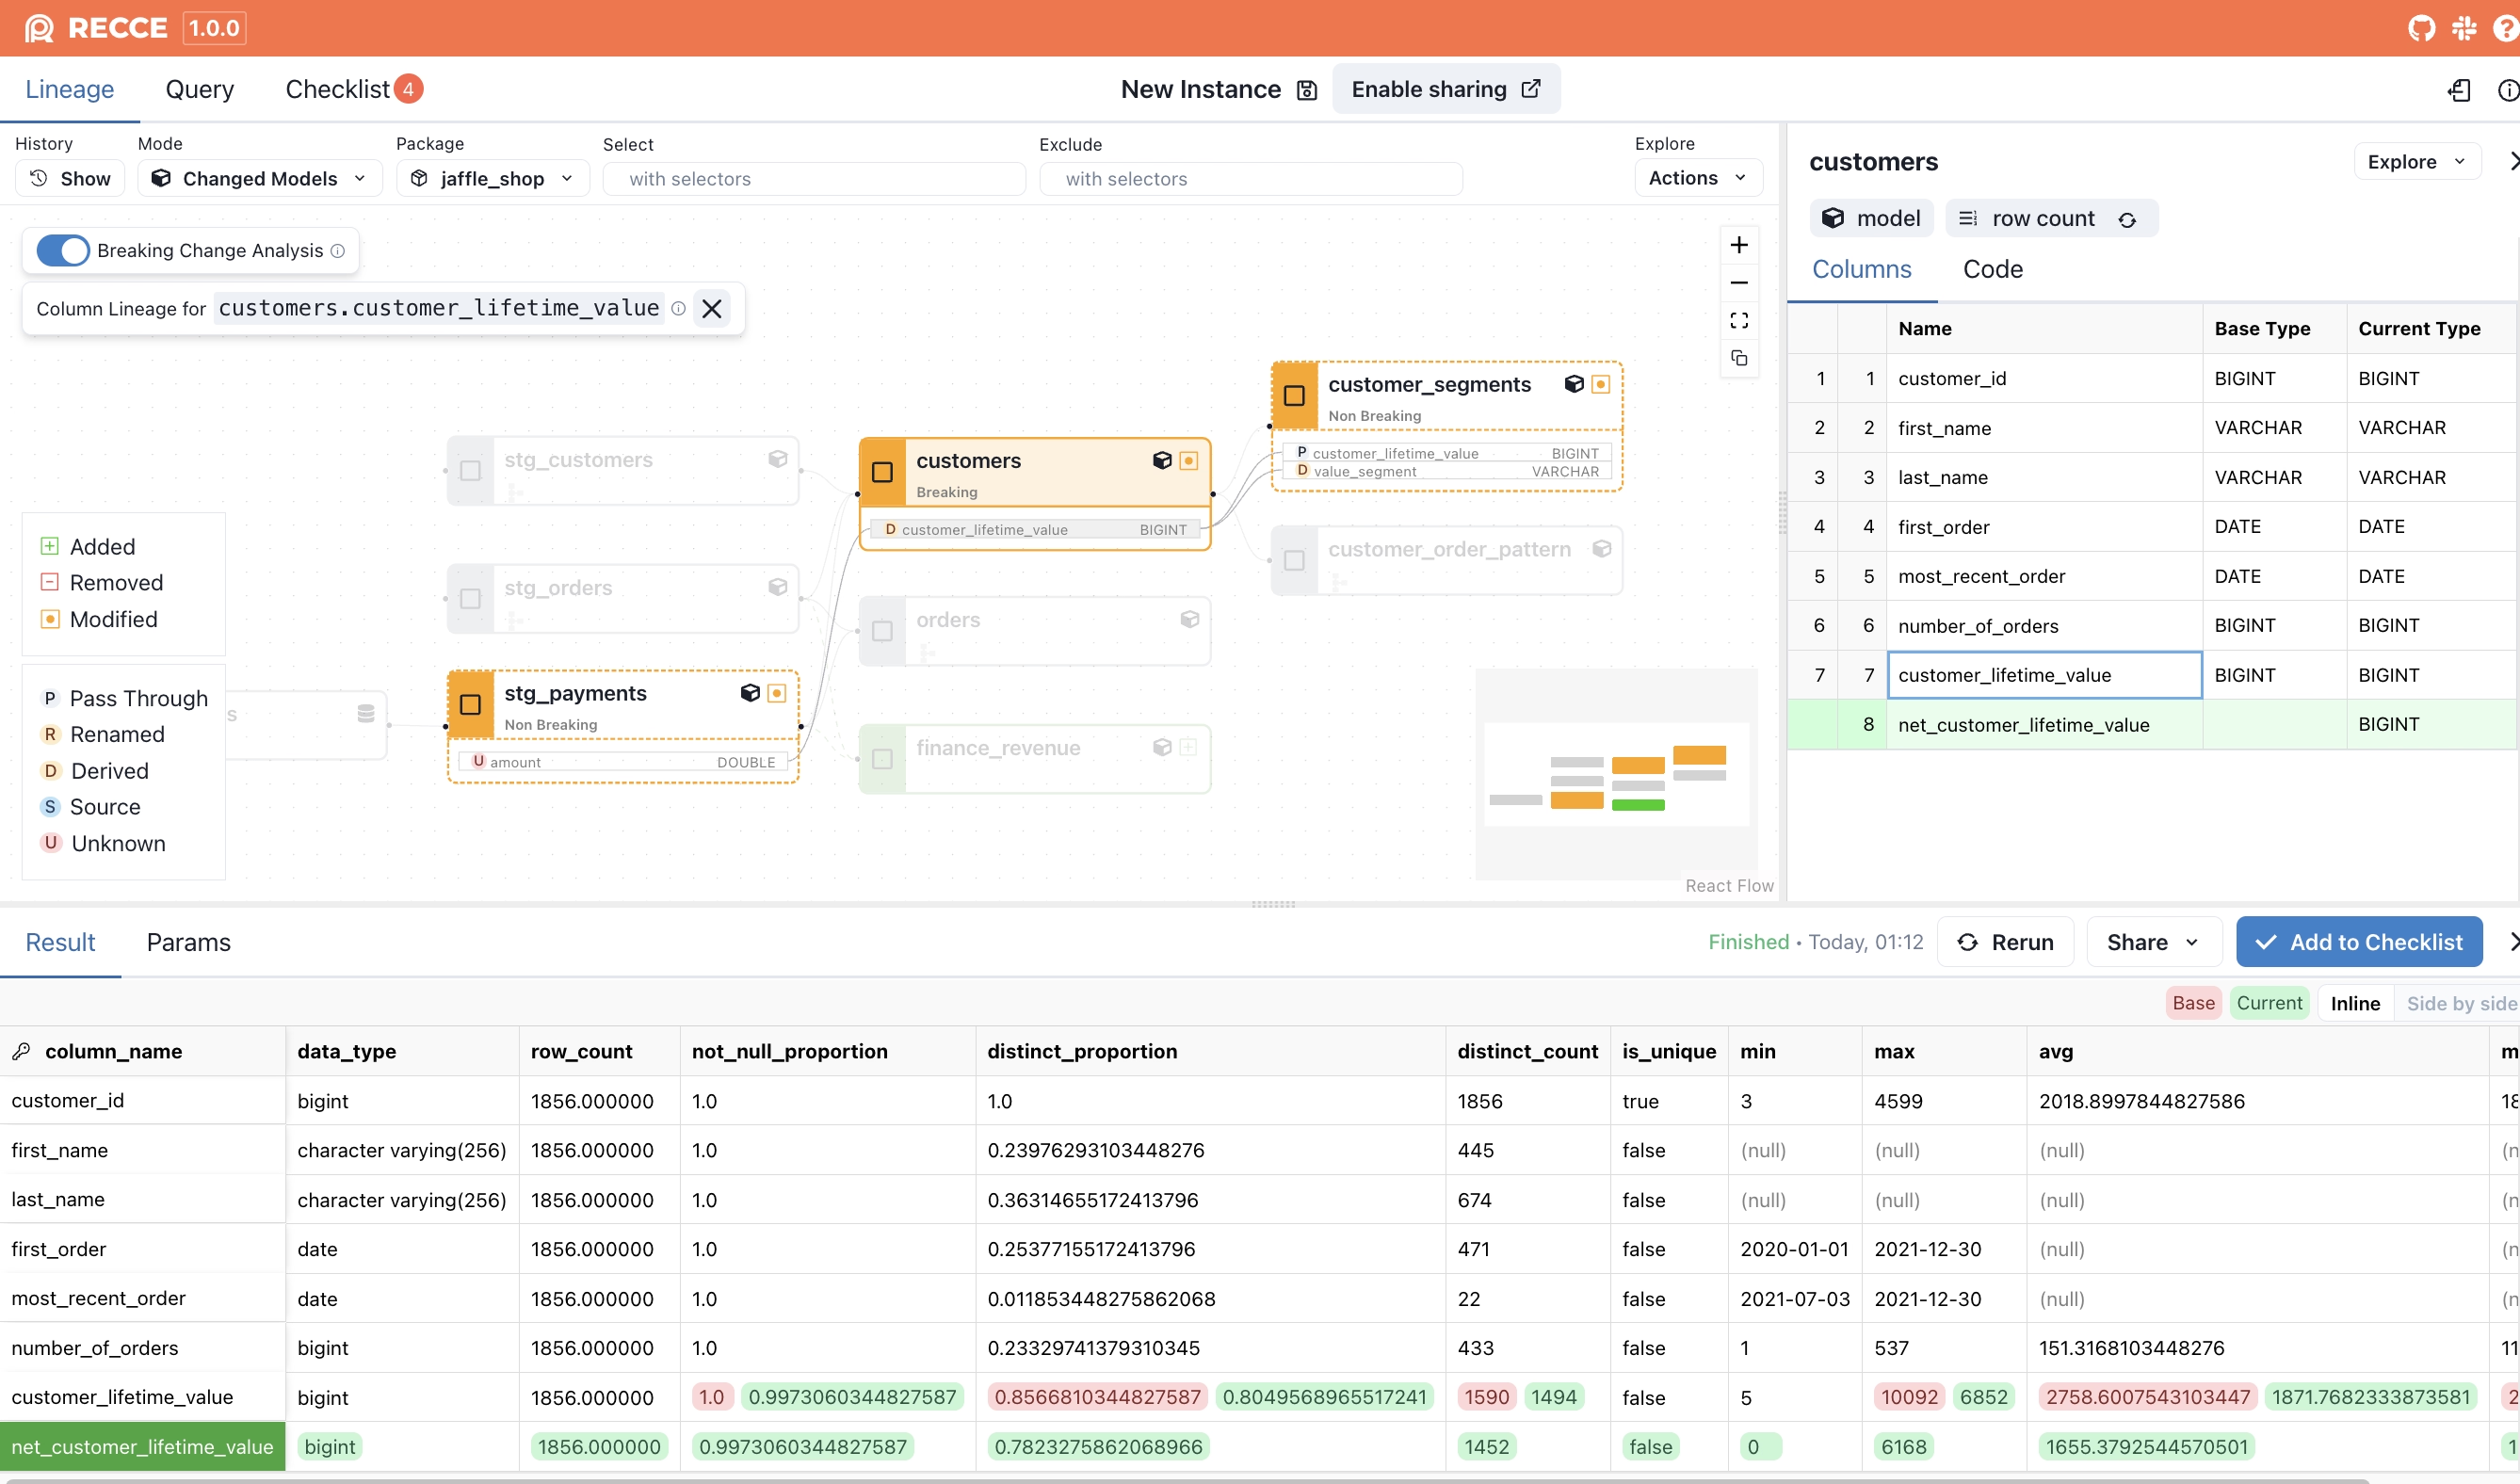
- Make CLV changes tangible for stakeholders. Using the custom queries feature, the team can compare customer-level CLV before and after the fix. Instead of writing complex JOINs, they simply ran two versions of the same query:
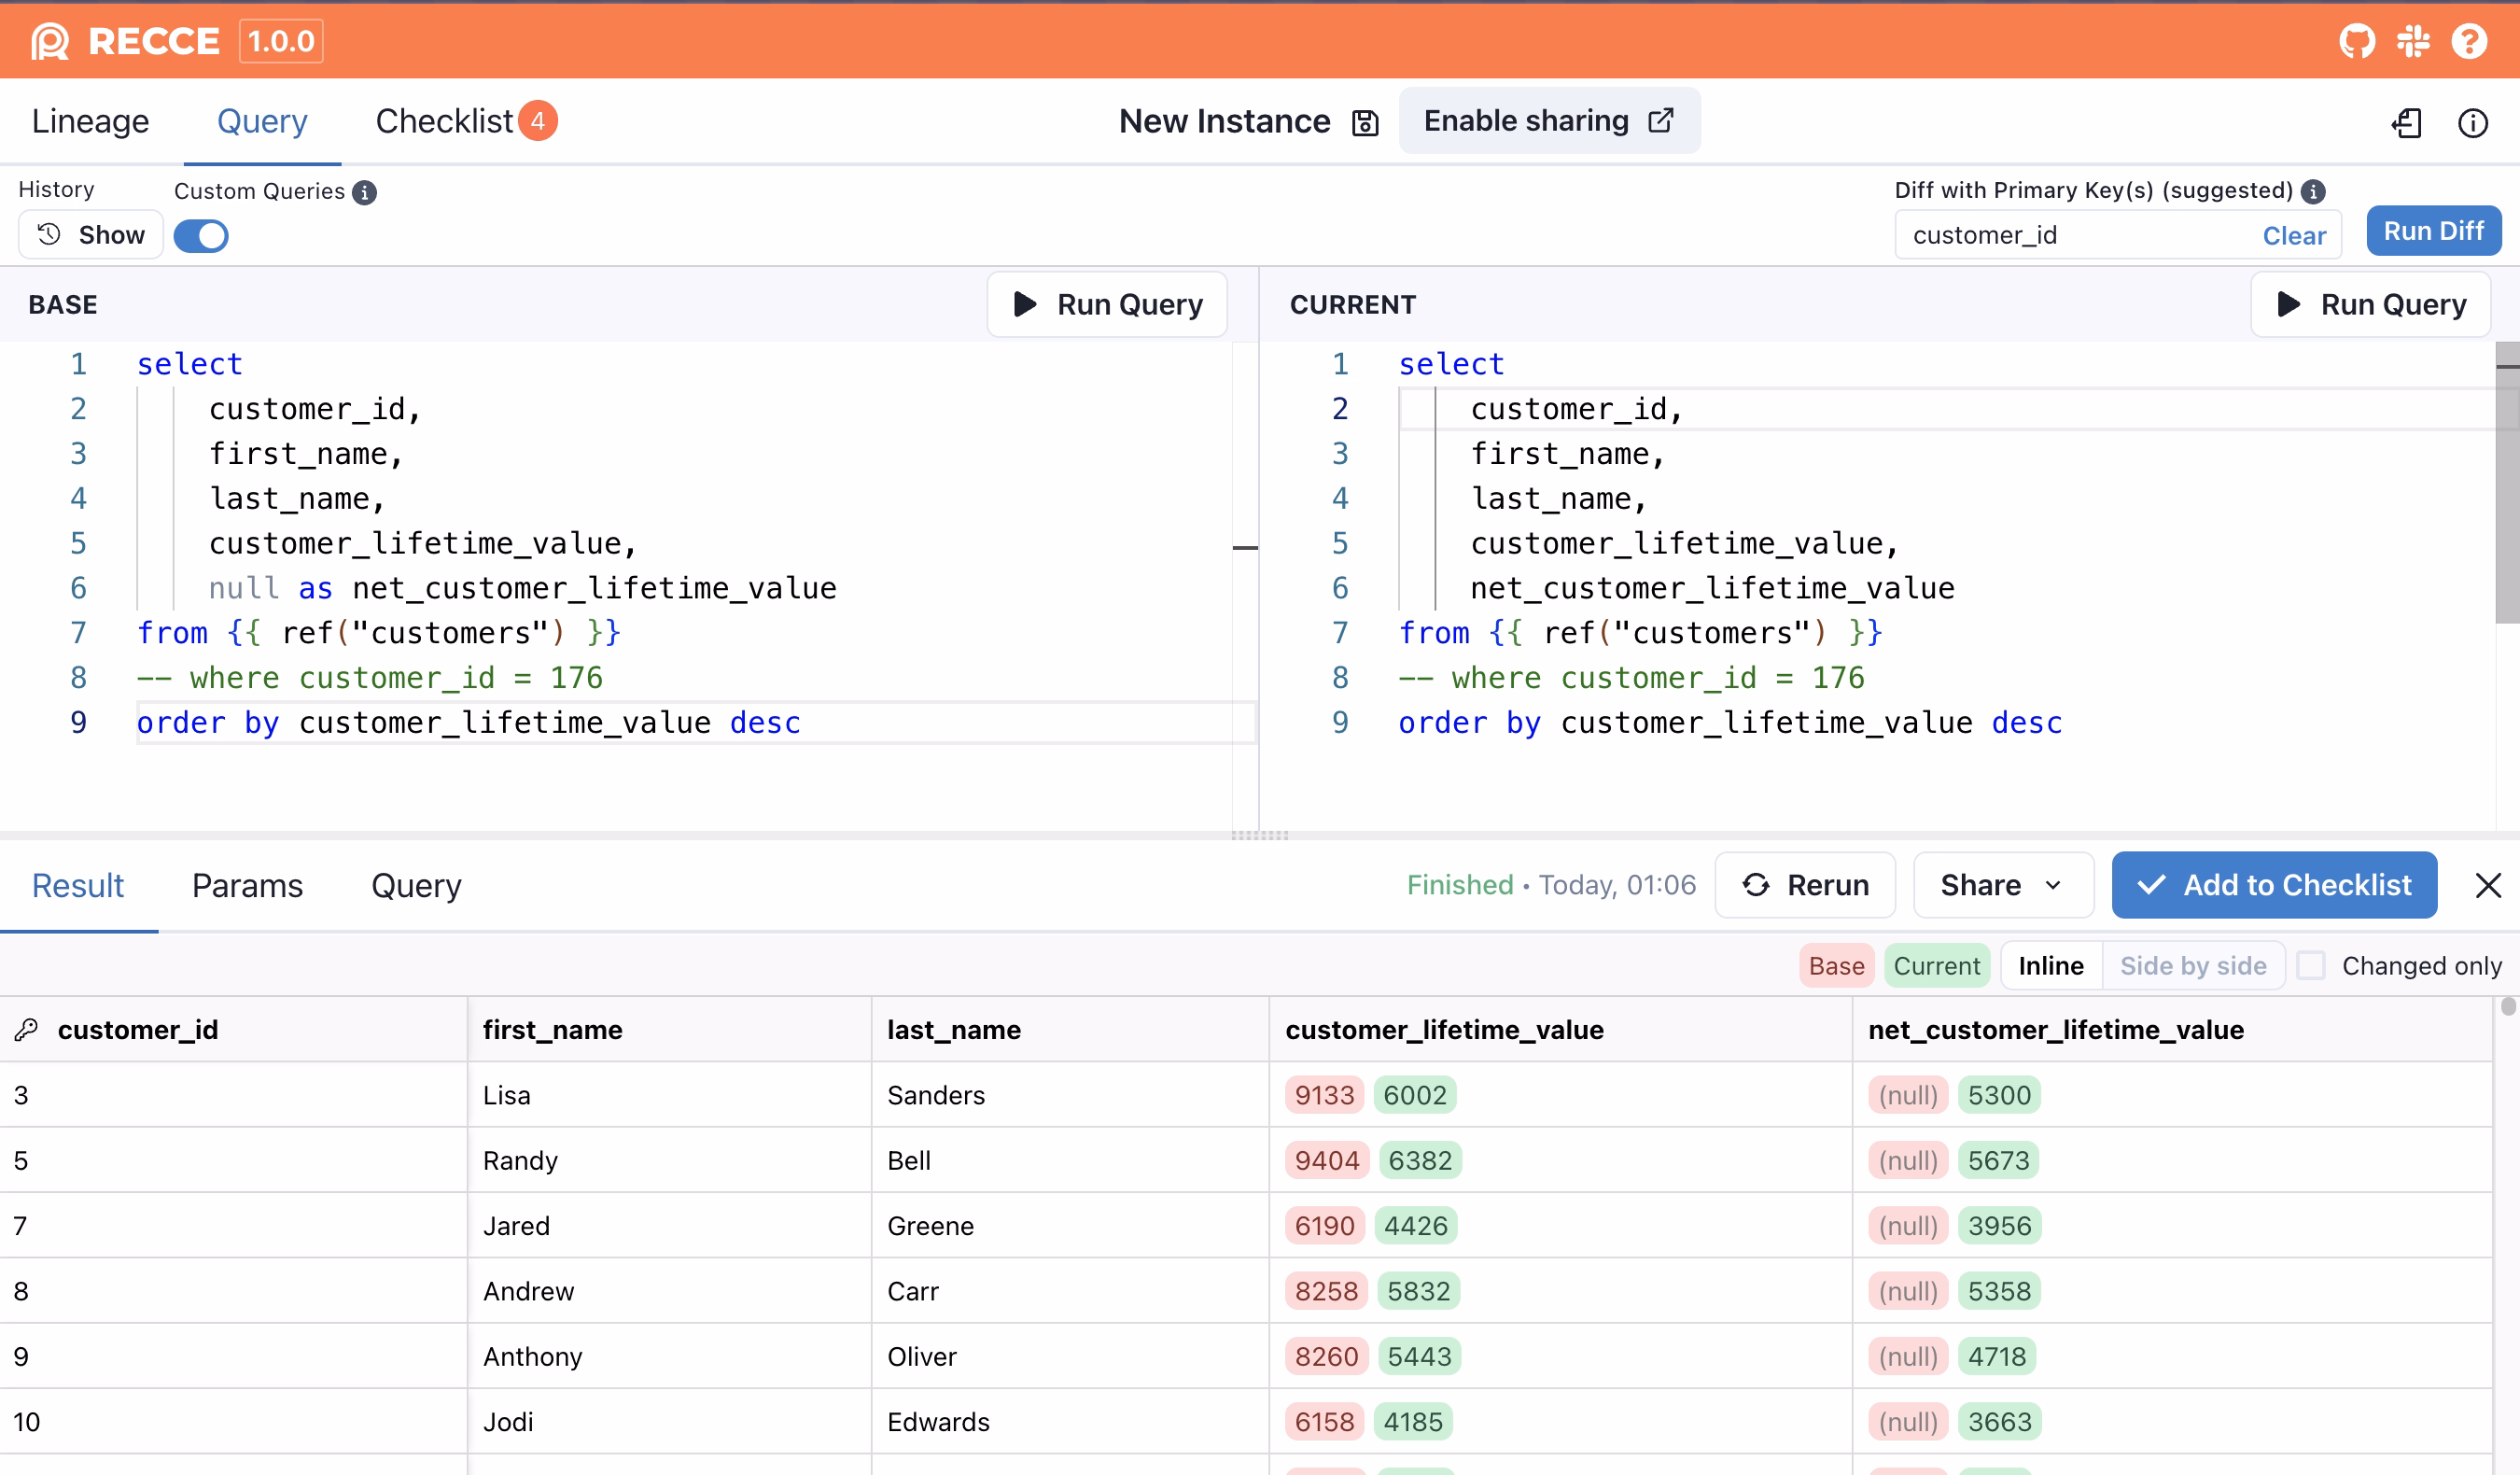
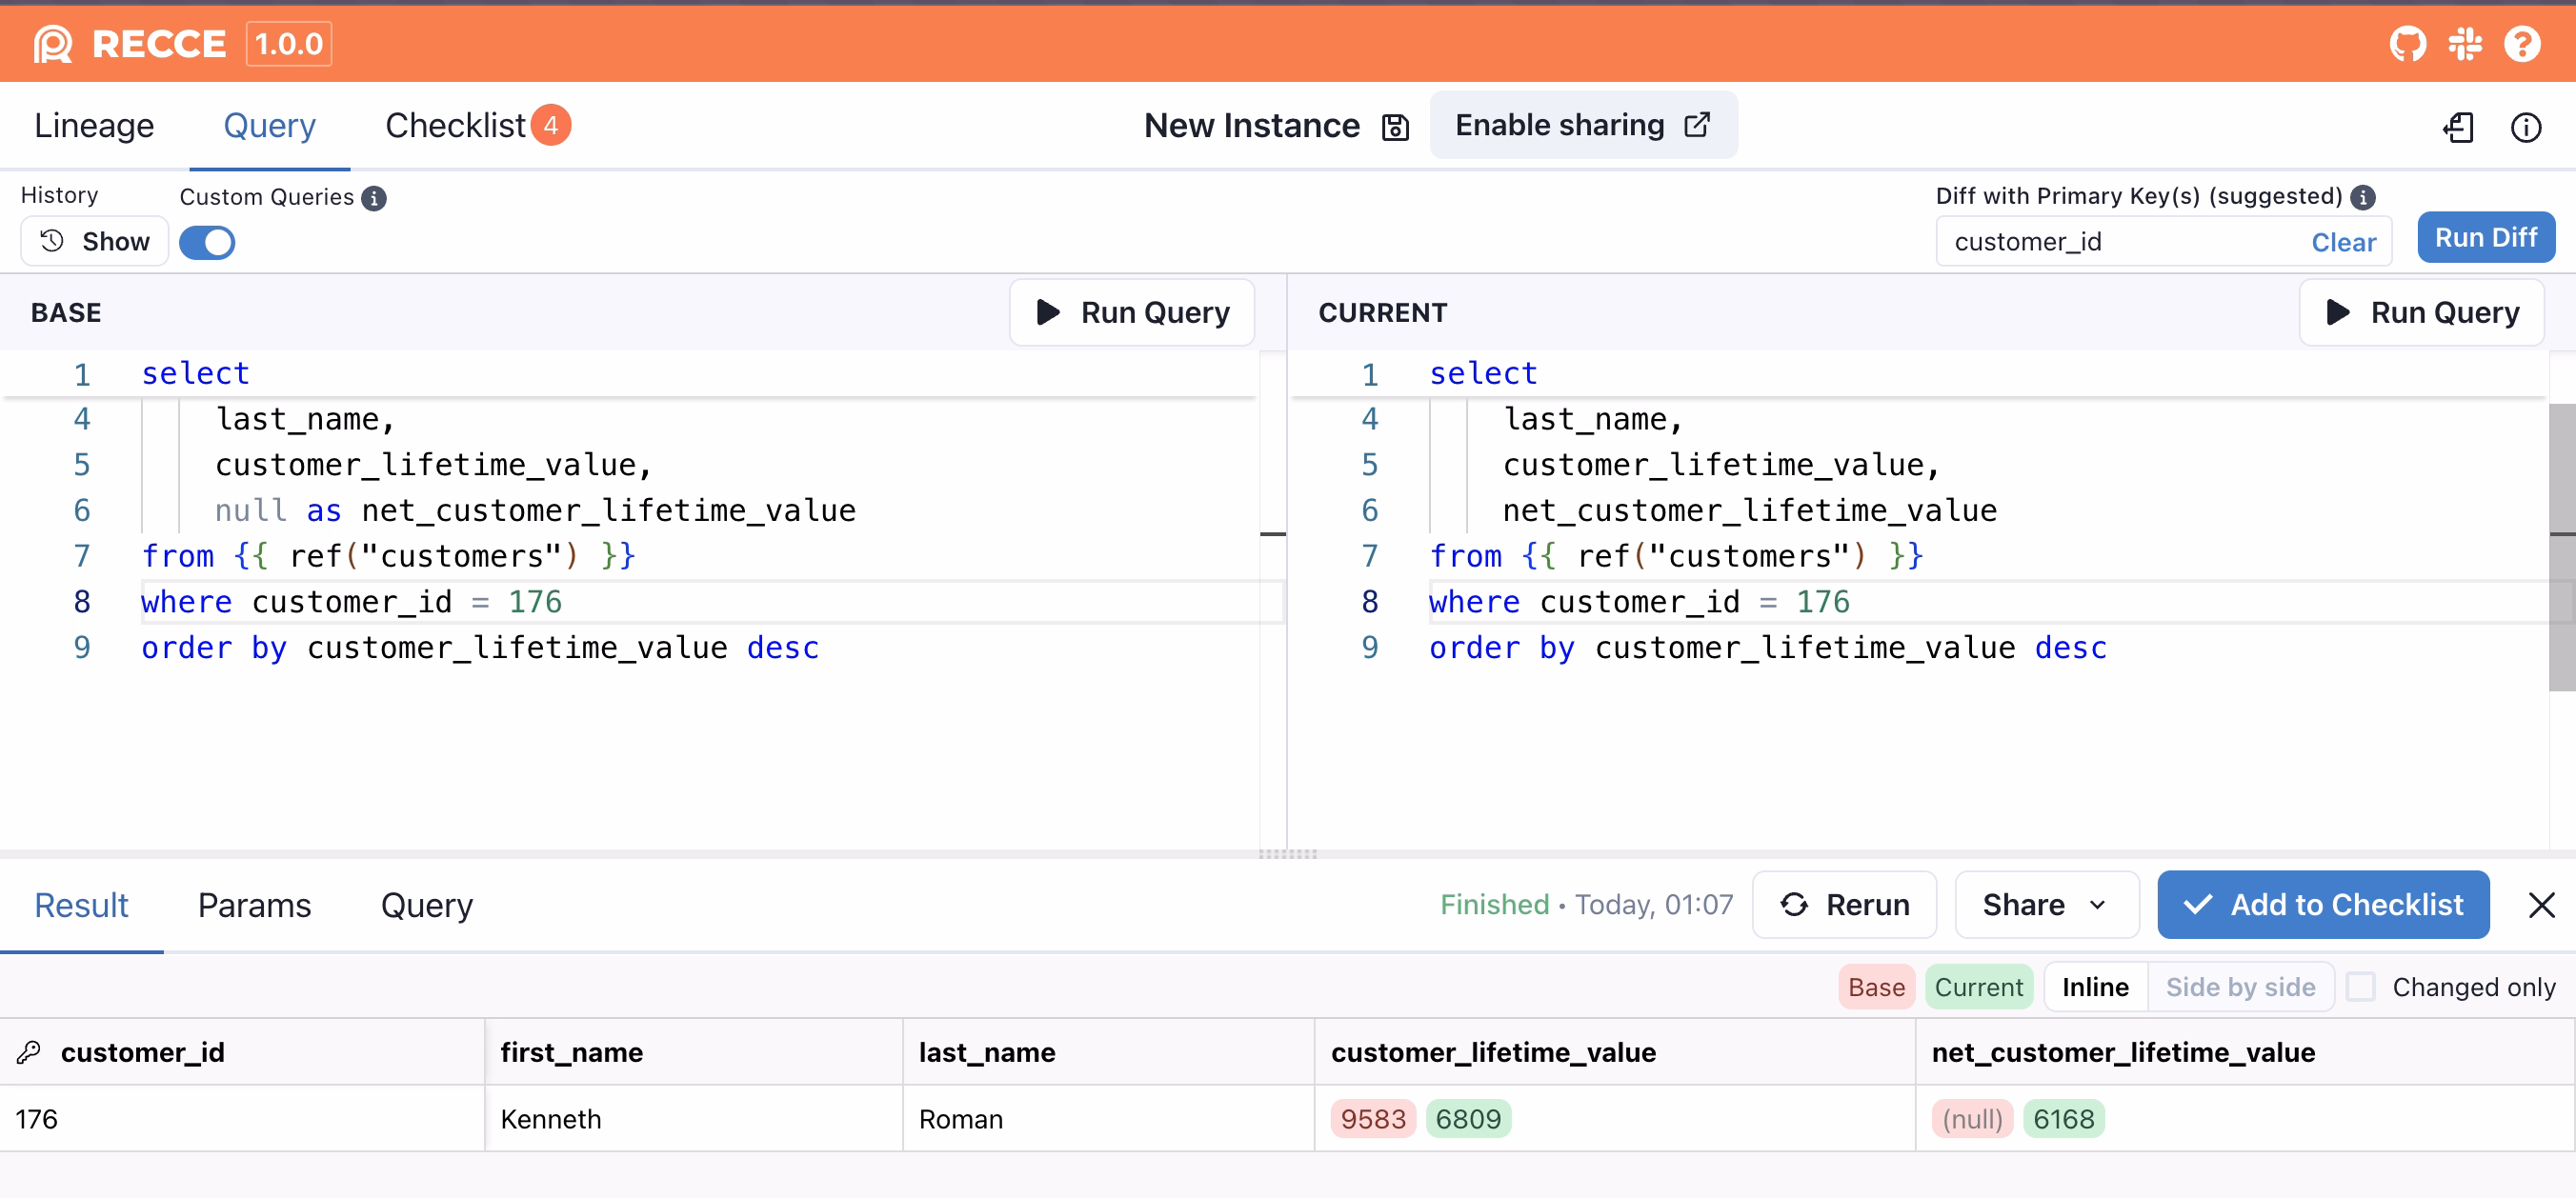
Spot-checking a single customer is just as simple:
-- base
select
    customer_id,
    first_name,
    last_name,
    customer_lifetime_value,
    null as net_customer_lifetime_value
from {{ ref("customers") }}
-- where customer_id = 176
order by customer_lifetime_value desc

-- current
select
    customer_id,
    first_name,
    last_name,
    customer_lifetime_value,
    net_customer_lifetime_value
from {{ ref("customers") }}
-- where customer_id = 176
order by customer_lifetime_value desc-
Trace all downstream impact within seconds. With Recce, the team replaced hours of manual and fragile tracing with breaking change analysis and column-level lineage. Instead of scanning SQL files or expanding the entire DAG, they simply turned on the lineage graph and immediately saw that: - Only the
customersmodel introduced a breaking change. - Only two columns were affected:customer_lifetime_valueand the newly addednet_customer_lifetime_value. - The only downstream model using those specific columns?customer_segments.😙 From three modified models and countless downstream guesses to just one clear, targeted validation.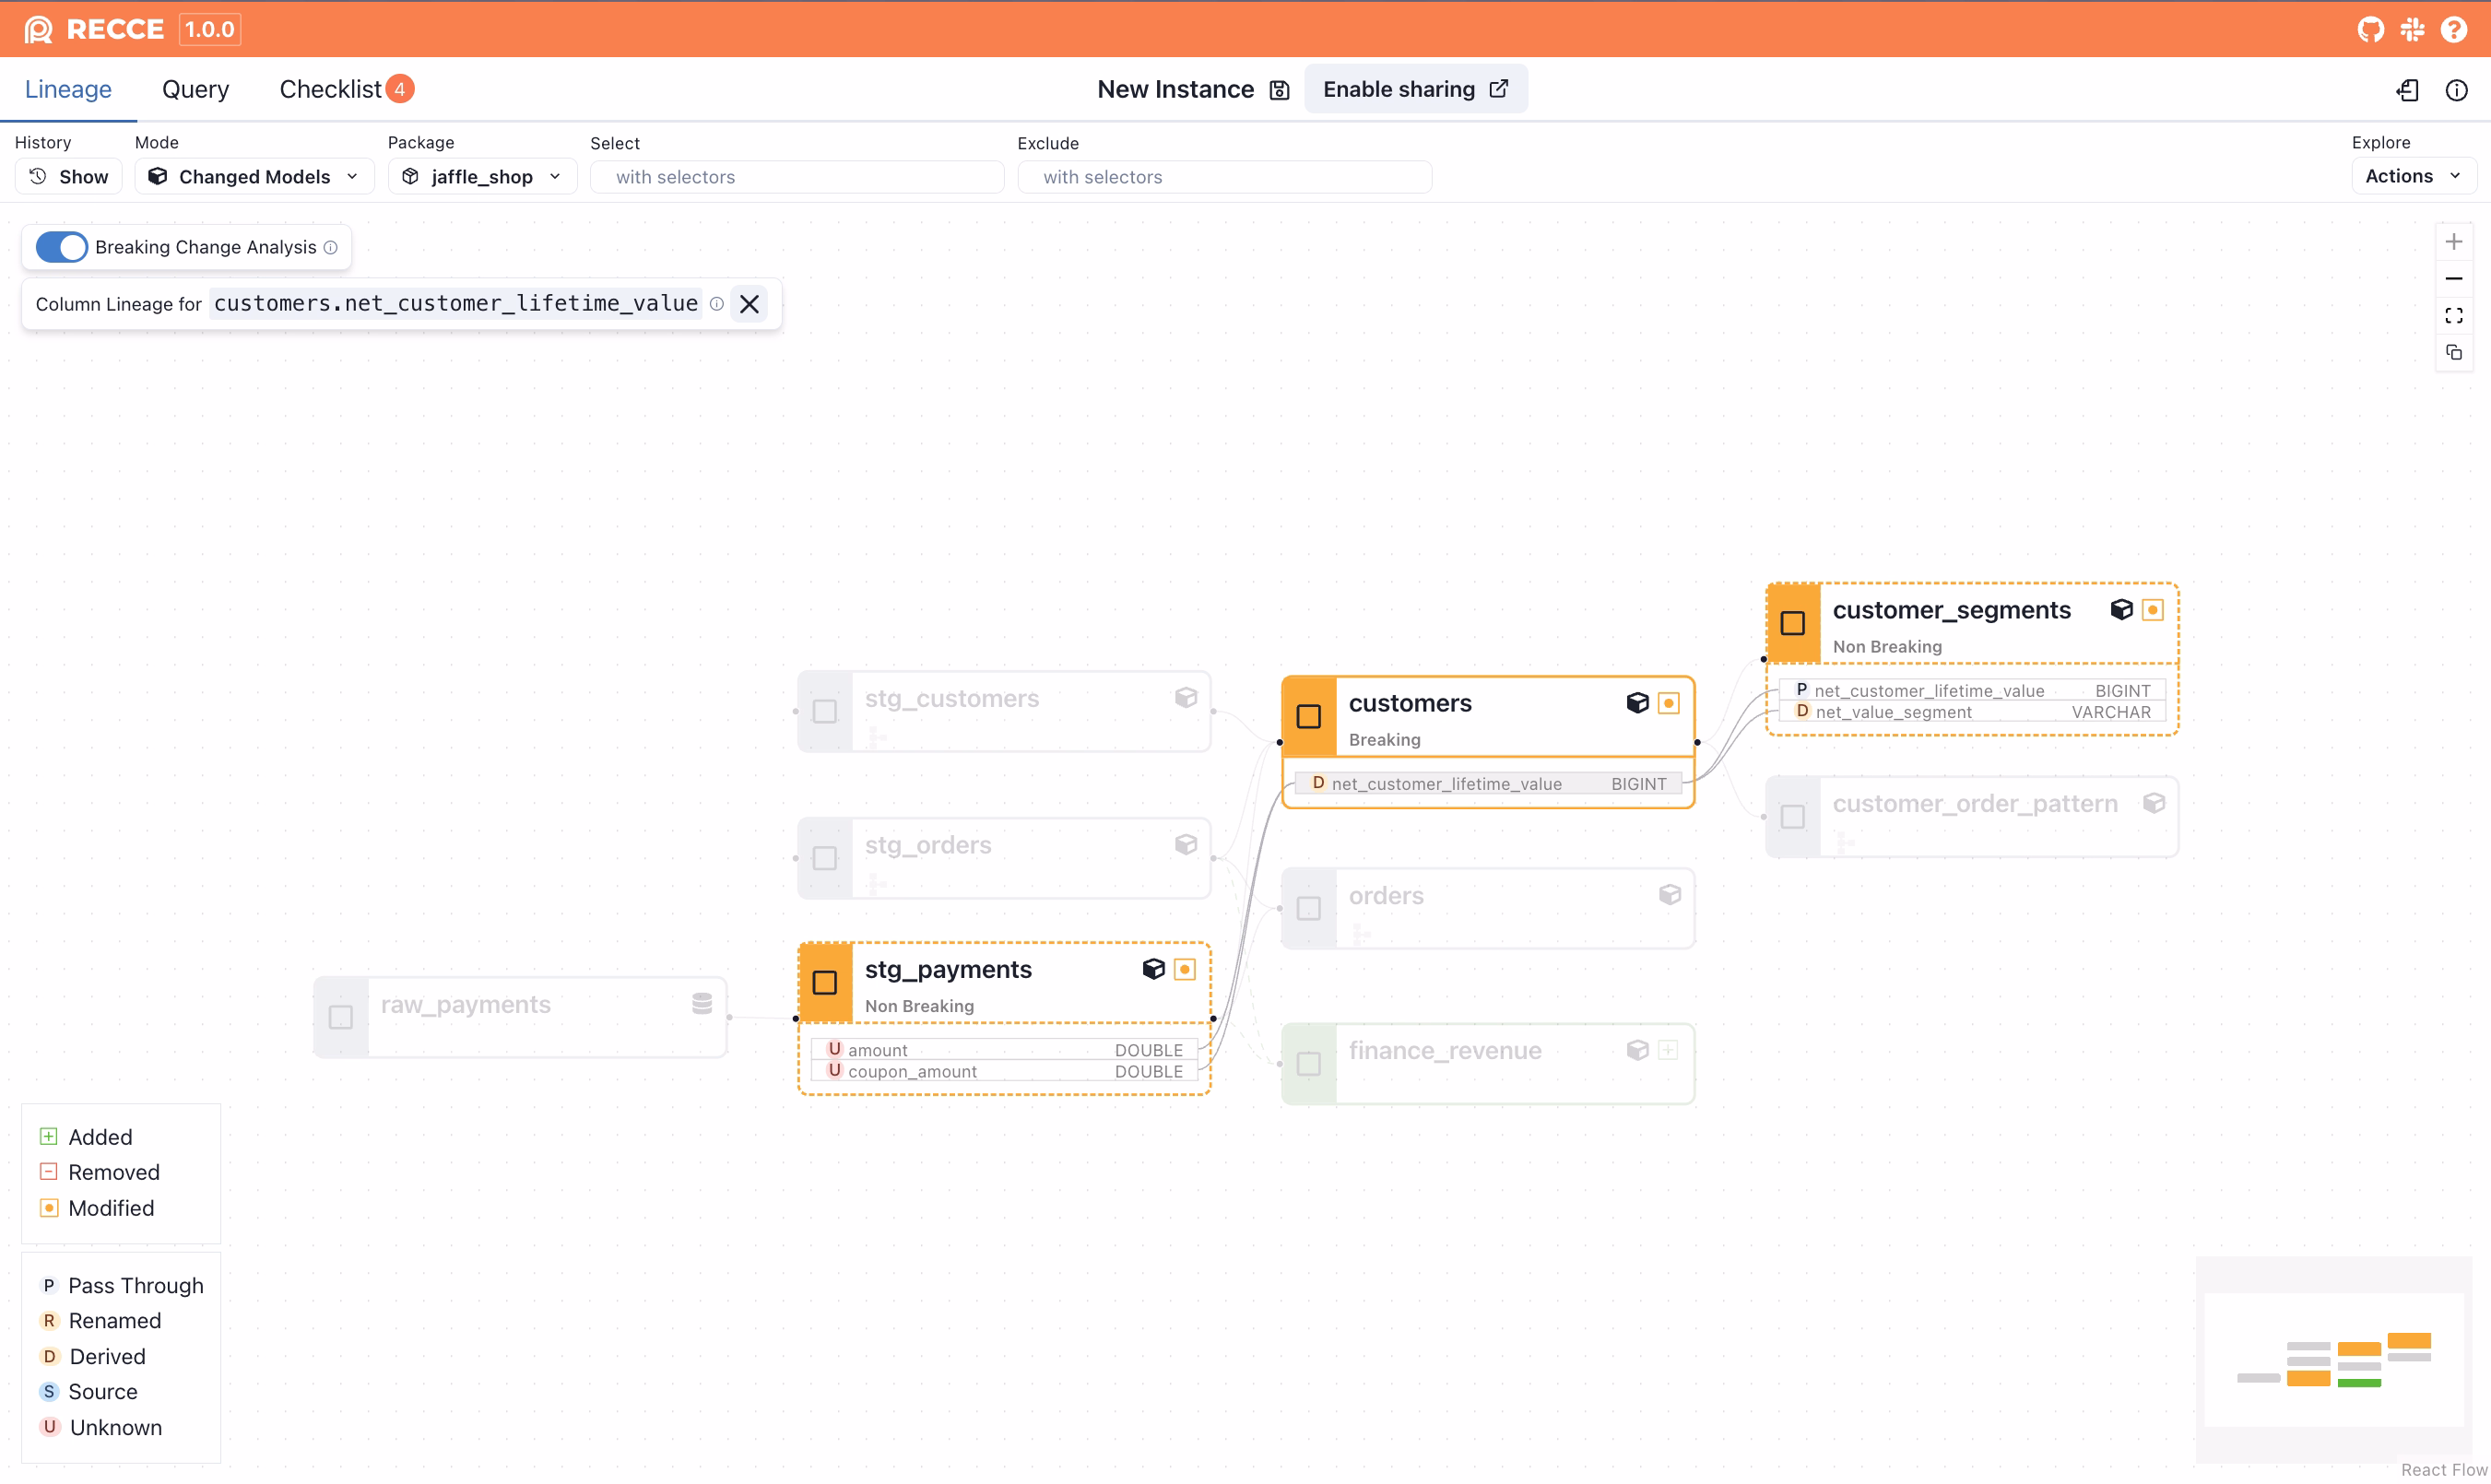

-
Understand the impact on
customer_segments. Now that the team knew onlycustomer_segmentswas affected, they moved straight to validation. Recce’s Top-K Diff instantly visualizes how customers shift between value segments after the fix with no additional SQL required.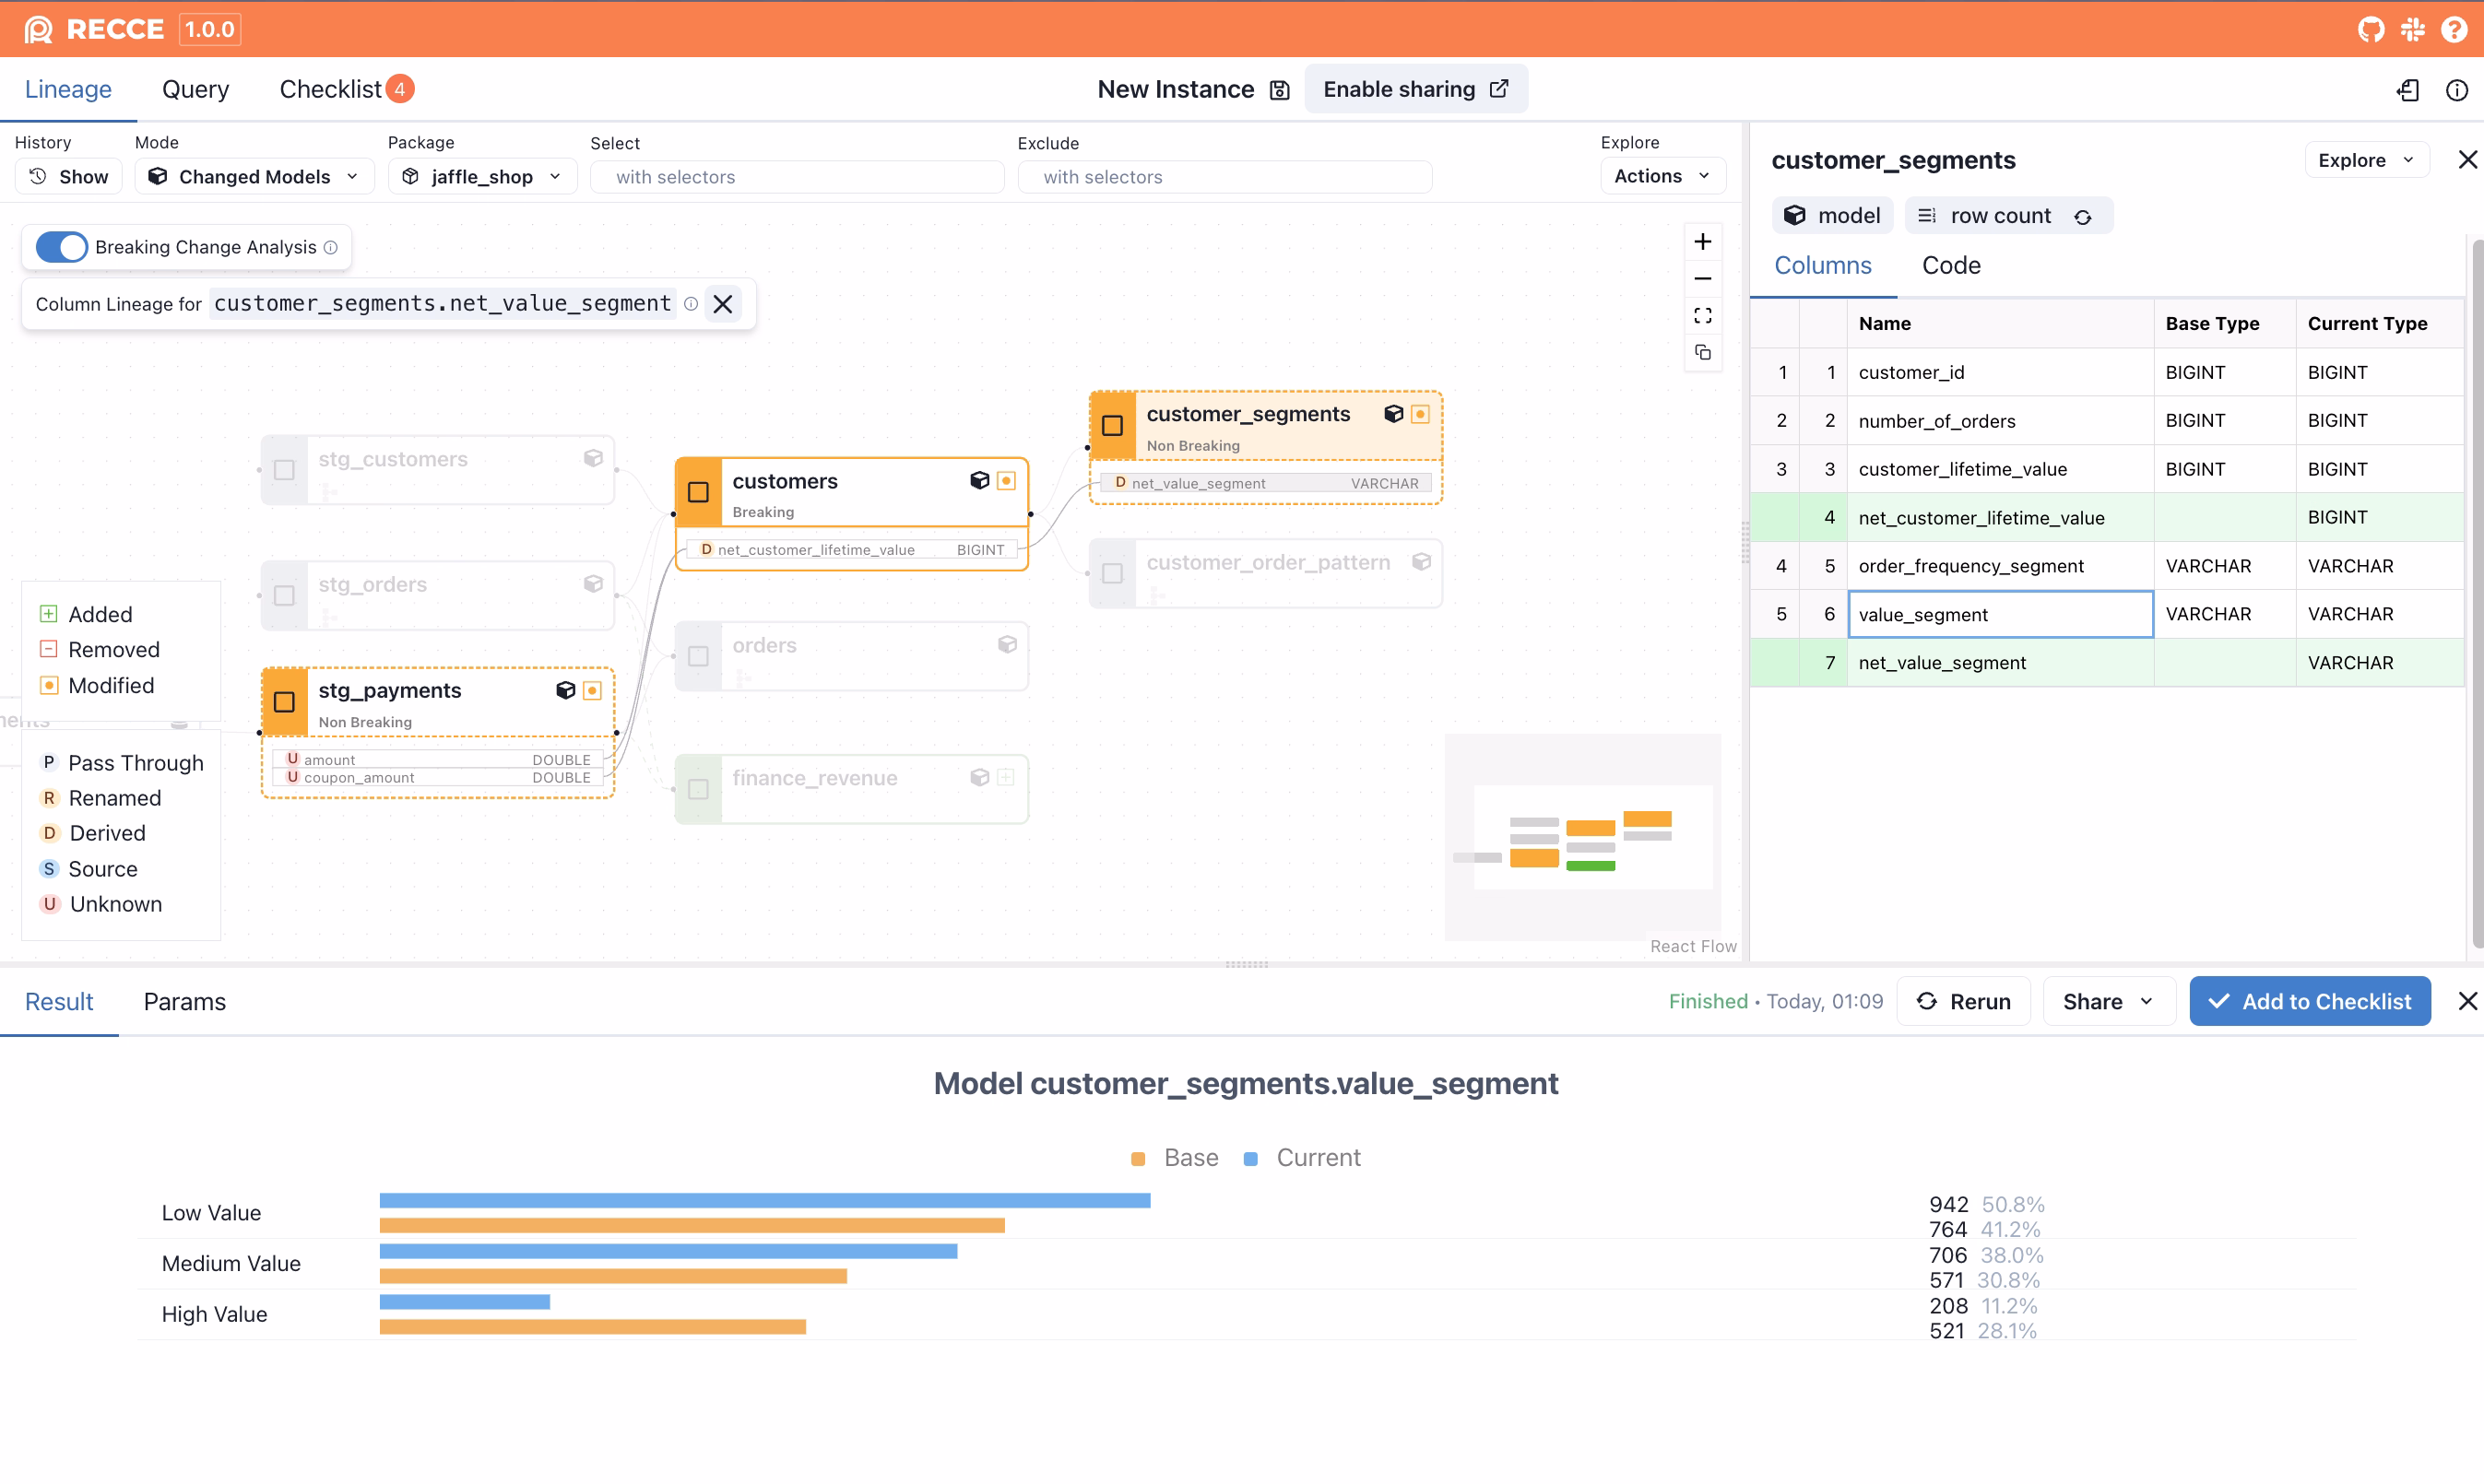
-
Validate the new
finance_revenuemodel with clarity and context. The same result is now achieved by writing two simple queries, one for the base logic and one for the new model, using Recce’s custom query interface. Recce automatically highlights differences in the results, making it easy to validate changes without needing complex SQL. The team then shared a link with the finance team so they could view the results inline (see more on sharing below). No exports, no spreadsheets, no duplication. ✌️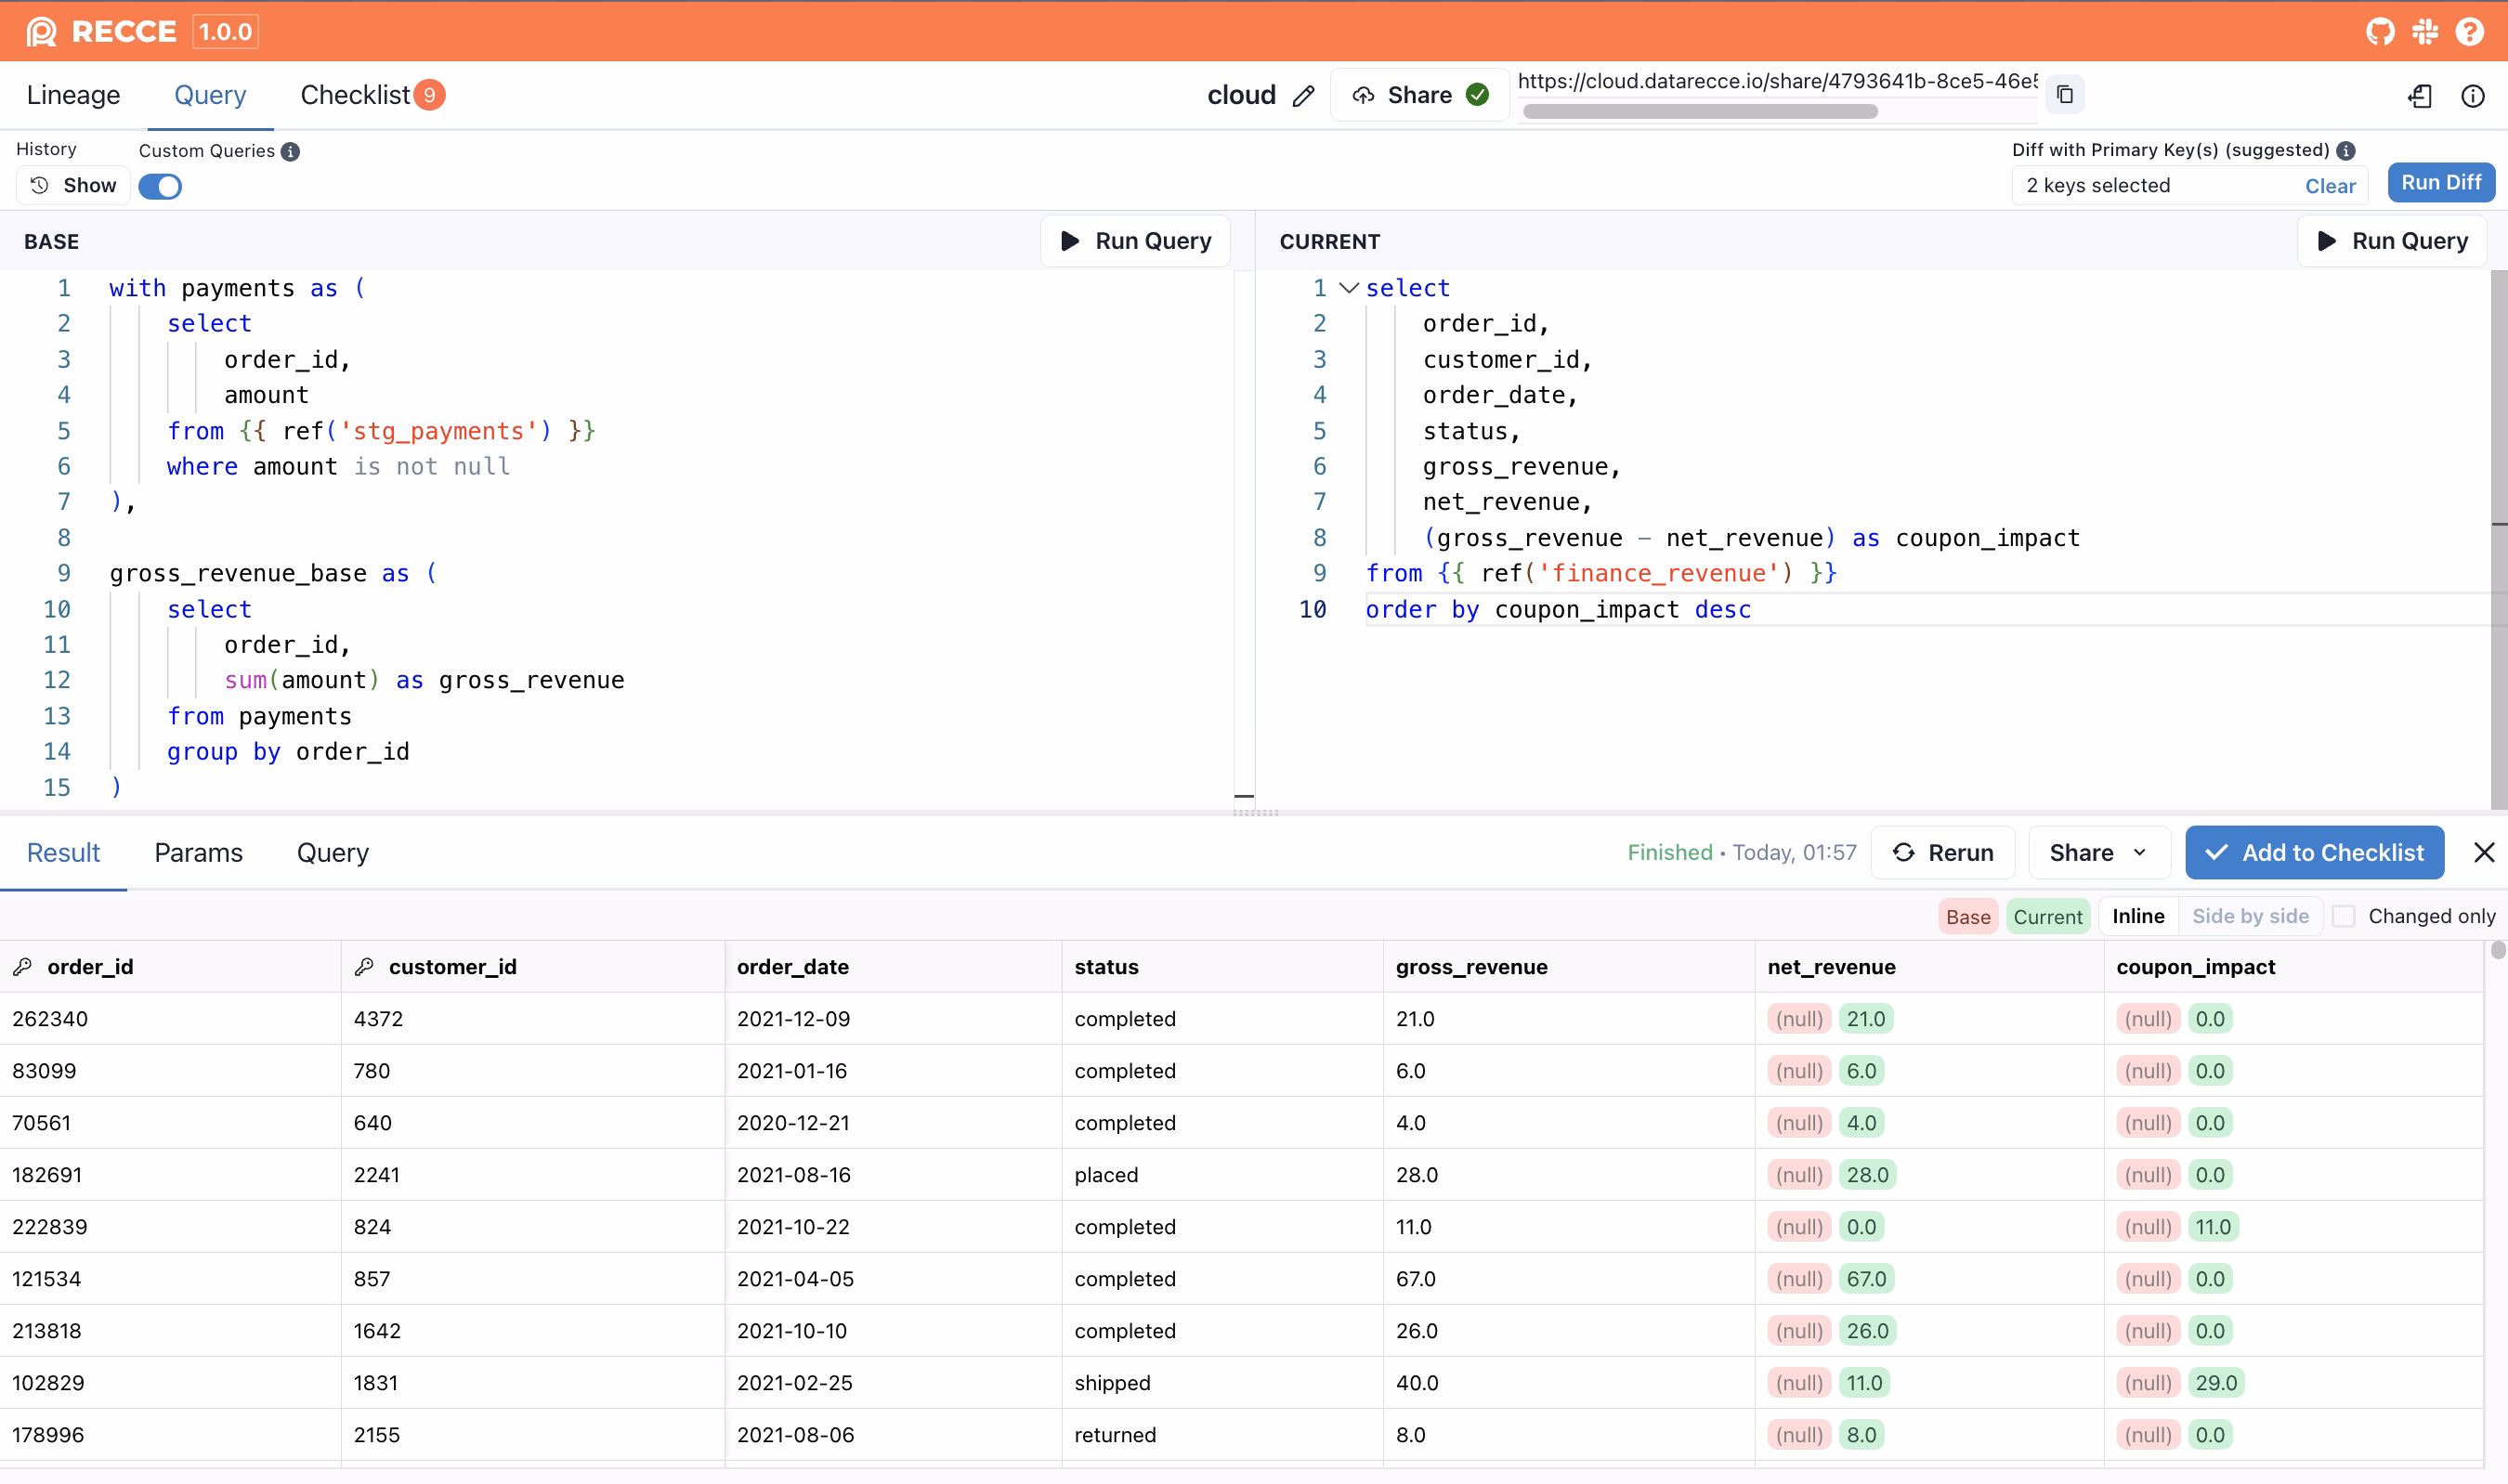
-- base
with payments as (
    select
        order_id,
        amount
    from {{ ref('stg_payments') }}
    where amount is not null
),

gross_revenue_base as (
    select
        order_id,
        sum(amount) as gross_revenue
    from payments
    group by order_id
)

select
    o.order_id,
    o.customer_id,
    o.order_date,
    o.status,
    b.gross_revenue,
    null as net_revenue,
    null as coupon_impact
from {{ ref('stg_orders') }} o
left join gross_revenue_base b on o.order_id = b.order_id
order by b.gross_revenue desc


-- current
select
    order_id,
    customer_id,
    order_date,
    status,
    gross_revenue,
    net_revenue,
    (gross_revenue - net_revenue) as coupon_impact
from {{ ref('finance_revenue') }}
order by coupon_impact desc
The data team also added each of the above query results into a checklist along with comments explaining the purpose and findings. Whether it’s another data team member reviewing the change or a stakeholder validating the impact, the checklist serves as a clear, self-contained artifact. It makes collaboration smoother by turning complex context into something easy to understand, discuss, and agree on ✅.

Instead of Piecemeal Screenshots and Spreadsheets, Share the Whole Story
With Recce Cloud, the data team could go one step further: share the entire investigation, the solution, and impacts directly with stakeholders.
No more stitching screenshots or exporting CSVs. Stakeholders could explore lineage, review the queries used to validate fixes (all captured in the checklist), and understand the root cause and solution so conversations could focus on collaboration, not catching up.
🔗 This story is live on Recce Cloud. You can explore the full investigation environment here: https://cloud.datarecce.io/share/4793641b-8ce5-46e5-84e3-7a76cc8b4c1b
👉 Learn more about Recce Cloud
From Ad Hoc to Repeatable: The Real Path to Velocity
With all the manual effort involved in the initial CLV investigation—piecing together lineage, writing custom queries, exporting to Excel, and walking stakeholders through every step—the data team barely had time to think about speed, let alone build a repeatable process. They gave up on having a standard way to validate. Every change was ad hoc and eye-balling line by line.
But once the team could surface both the root cause and the fix in a structured, explainable way, validation became faster, clearer, and more collaborative. That’s how they earned back trust and unlocked velocity.
That’s exactly what Recce is here to help with:
- Viewability: Easily surface what’s changed and why.
- Verifiability: Prepare evidence and bring others into the loop transparently.
- Velocity: Build toward a repeatable, automated way to validate changes with confidence.
It’s not just about moving fast, it’s about making trust and quality the foundation for doing so.
At Recce, we believe business context is essential to getting data right. Correctness isn’t just about passing tests, it’s about making sure numbers reflect how the business actually works. That’s why humans still matter in the loop. Stakeholders who use the metrics every day are key collaborators. They help the data team define what’s correct, what should be codified into tests, and what needs to remain a shared understanding.
That’s the path to trustworthy data and sustainable speed.